Fig. 1
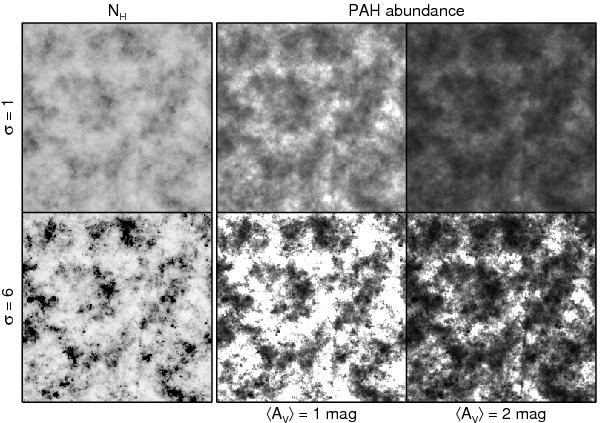
Visualization of the effect caused by PAH destruction below a critical column density [NH] crit = 1021 cm-2. The density structure is derived using a cube of 2563 Pixel, a power index of n = −10/3 and a maximum length scale of 0.4 times the cube size. To the left the column density for two standard deviations σρ/ ⟨ ρ ⟩ of the local density is shown. The images to the right for each turbulent cube gives the PAH abundance along individual sight lines for two assumptions of the extinction AV through the cube. The white fields correspond to no PAH molecules while the black fields have the normal PAH abundance necessary to produce the extinction bump at 2175 Å.
Current usage metrics show cumulative count of Article Views (full-text article views including HTML views, PDF and ePub downloads, according to the available data) and Abstracts Views on Vision4Press platform.
Data correspond to usage on the plateform after 2015. The current usage metrics is available 48-96 hours after online publication and is updated daily on week days.
Initial download of the metrics may take a while.