Fig. 2
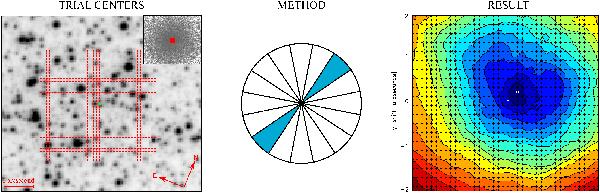
The method to determine the globular cluster center. From left to right: a zoom into our HST/ACS image of NGC 6388 (used to derive the CMD and luminosity profile for the cluster) with the over-layed grid of trial centers. Around each trial center, differential stellar counts and stellar luminosity were computed in two opposite wedges extending 15′′ in radius (middle panel). A minimization of the residuals, as shown in the contour plot (right panel) determines the center to within 0.2′′. The distances between the contours vary between 40−70 stars for the star count methods.
Current usage metrics show cumulative count of Article Views (full-text article views including HTML views, PDF and ePub downloads, according to the available data) and Abstracts Views on Vision4Press platform.
Data correspond to usage on the plateform after 2015. The current usage metrics is available 48-96 hours after online publication and is updated daily on week days.
Initial download of the metrics may take a while.