Fig. 12
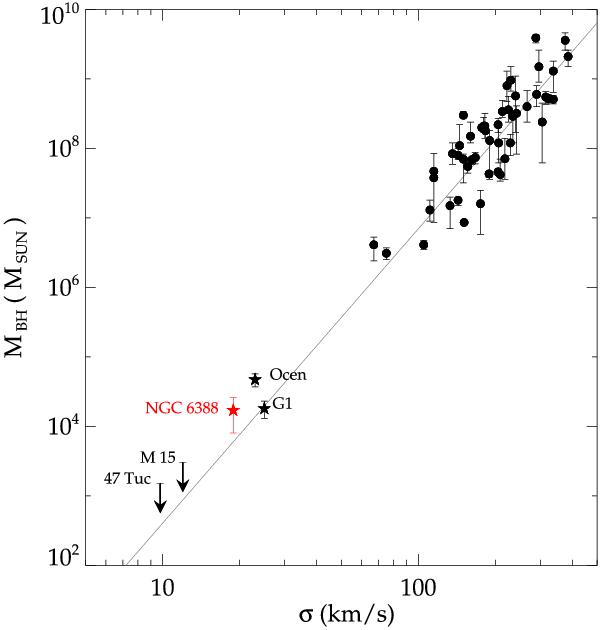
The M• − σ relation for galaxies at the high mass range (filled circles) and the first globular clusters with potential black hole detection (filled stars). The slope of the line log (M•/M⊙) = α + β log (σ/200 km s-1) with (α,β) = (8.12 ± 0.08,4.24 ± 0.41) was taken from Gültekin et al. (2009). The mass of the black holes of ω Centauri, G1 and the upper limits of M15 and 47 Tuc were obtained by Noyola et al. (2010), Gebhardt et al. (2005), van den Bosch et al. (2006) and McLaughlin et al. (2006), respectively. Overplotted is the result of NGC 6388 with our derived effective velocity dispersion σe = 18.9 km s-1.
Current usage metrics show cumulative count of Article Views (full-text article views including HTML views, PDF and ePub downloads, according to the available data) and Abstracts Views on Vision4Press platform.
Data correspond to usage on the plateform after 2015. The current usage metrics is available 48-96 hours after online publication and is updated daily on week days.
Initial download of the metrics may take a while.