Fig. 6
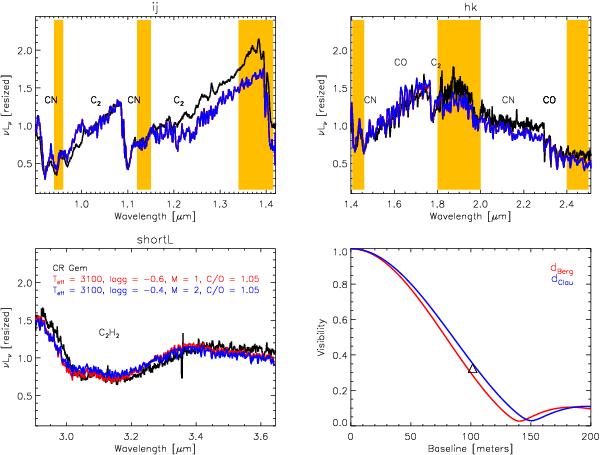
Comparison of the UKIRT/UIST spectra (black line) and PTI interferometric measurements (black triangle) of CR Gem with hydrostatic model predictions. The upper left panel illustrates the IJ range of the spectrum, the upper right panel shows the HK wavelength range. The lower left panel shows the short L range. The shaded bands mark the region with poor atmospheric transmission. The molecules that contribute to the spectrum are also indicated. The synthetic spectra are overplotted in grey (blue, and red in the electronic version). The lower right panel shows the interferometric data point with the models which best fit the data for different distances overplotted.
Current usage metrics show cumulative count of Article Views (full-text article views including HTML views, PDF and ePub downloads, according to the available data) and Abstracts Views on Vision4Press platform.
Data correspond to usage on the plateform after 2015. The current usage metrics is available 48-96 hours after online publication and is updated daily on week days.
Initial download of the metrics may take a while.