Fig. 5
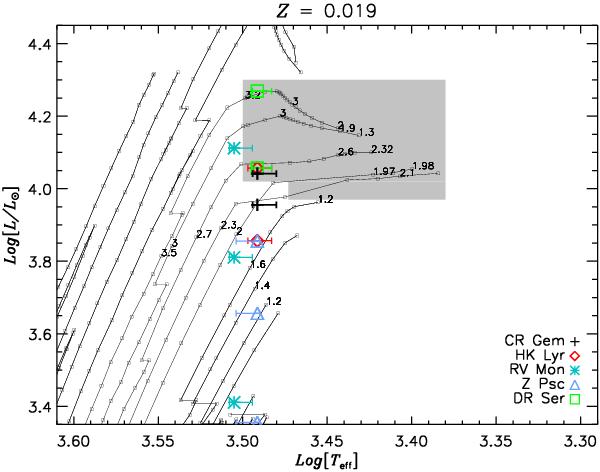
Zoom into the H-R diagram where C-stars are located. The solar metallicity isochrones (Marigo et al. 2008) are plotted in grey and the small numbers indicate the predicted present mass. The sampling of points in the isochrones is shown with tiny squares. The position of the C-stars is indicated by a shaded area, the uncertainty about this area is discussed in Sect. 5. The different symbols plotted correspond to the parameters determined for every star and distance assumed: plus for CR Gem, asterisk for HK Lyr, diamond for RV Mon, triangle for Z Psc, and square for DR Ser.
Current usage metrics show cumulative count of Article Views (full-text article views including HTML views, PDF and ePub downloads, according to the available data) and Abstracts Views on Vision4Press platform.
Data correspond to usage on the plateform after 2015. The current usage metrics is available 48-96 hours after online publication and is updated daily on week days.
Initial download of the metrics may take a while.