Free Access
Fig. 4
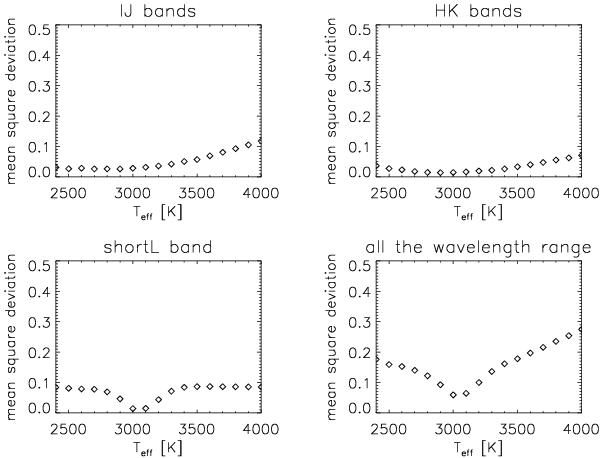
Four plots show the mean squared deviation obtained by fitting single portions of the spectra (IJ, HK, short L), and by fitting all the portions of spectra at once (all the wavelength range) for HK Lyr. These plots demonstrate the accuracy of the short L measurement.
Current usage metrics show cumulative count of Article Views (full-text article views including HTML views, PDF and ePub downloads, according to the available data) and Abstracts Views on Vision4Press platform.
Data correspond to usage on the plateform after 2015. The current usage metrics is available 48-96 hours after online publication and is updated daily on week days.
Initial download of the metrics may take a while.