Free Access
Fig. 3
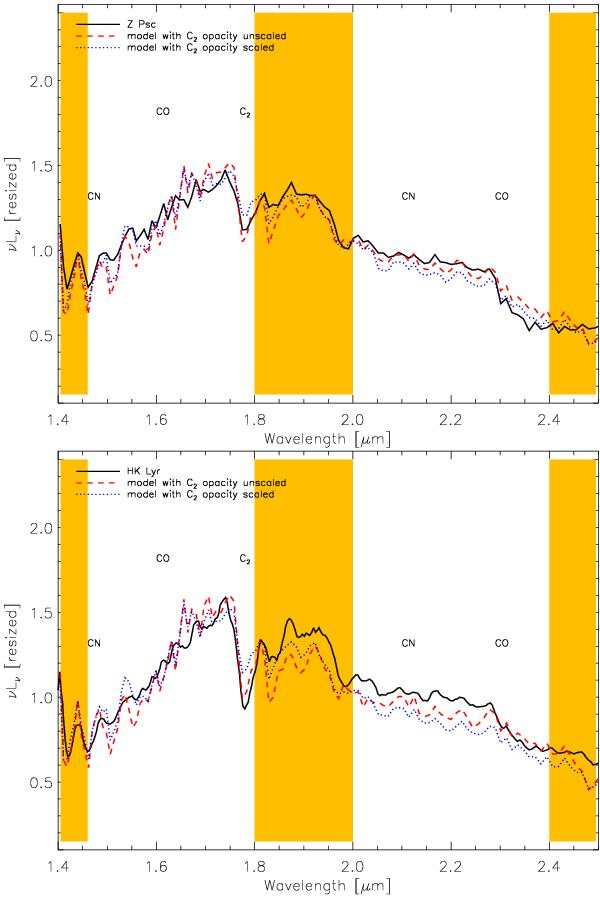
Comparison between the observed spectrum of two targets (black full line, Z Psc in the upper panel and HK Lyr in the lower), a spectrum computed assuming scaled C2 opacity (dotted line) and the spectrum with unscaled C2 (dashed line). Shaded bands mark regions of poor atmospheric transmission.
This figure is made of several images, please see below:
Current usage metrics show cumulative count of Article Views (full-text article views including HTML views, PDF and ePub downloads, according to the available data) and Abstracts Views on Vision4Press platform.
Data correspond to usage on the plateform after 2015. The current usage metrics is available 48-96 hours after online publication and is updated daily on week days.
Initial download of the metrics may take a while.