Fig. 2
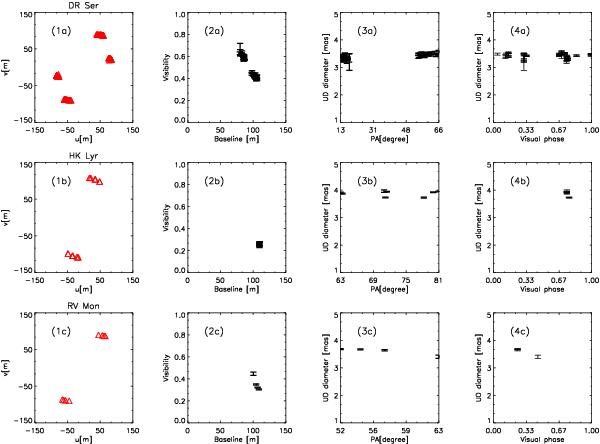
Checking of the hydrostatic and spherical symmetric approximation for the interferometric data. The series of panels “a” refers to DR Ser data, panels “b” to HK Lyr, and panels “c” to RV Mon. The plots in Col. “1” represents the uv-coverage of the observations, in Col. “2” the visibility points acquired are plotted versus the baselines. In Col. “3” the correspondent UD diameter is plotted versus position angle. In Col. “4” the UD diameter is plotted versus the visual phase.
Current usage metrics show cumulative count of Article Views (full-text article views including HTML views, PDF and ePub downloads, according to the available data) and Abstracts Views on Vision4Press platform.
Data correspond to usage on the plateform after 2015. The current usage metrics is available 48-96 hours after online publication and is updated daily on week days.
Initial download of the metrics may take a while.