Fig. 9
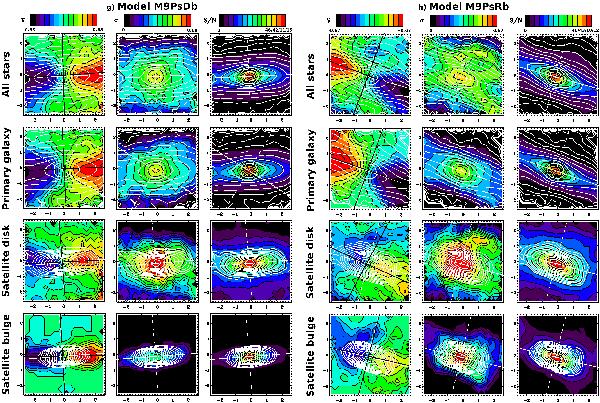
Line-of-sight rotation velocity, velocity dispersion, and signal-to-noise ratio (S/N) maps of the stellar material coming from different original components in the final remnants of models M9PsDb and M9PsRb, using an edge-on view of the remnants (experiments g and h in Table 3). The same levels have been used for the colour palette of the velocity maps of the different components in each model and in the velocity dispersion maps to highlight the high rotational support of the ICs resulting from satellite material (consult the bars on the top of the corresponding columns). Levels are distributed linearly. The maximum level in the bars corresponding to the S/N maps show four different values, corresponding to each one of the frames below, respectively. All physical magnitudes are provided in simulation units. First row: considering all the stars in the remnant. Second row: for the stars initially belonging to the primary galaxy. Third row: for the stars originally in the satellite disc. Fourth row: for the stars originally in the satellite bulge. Contours: surface iso-density contours in the final remnant of the material considered in each map, just as reference. White straight lines: photometric axes of the material considered in each panel. Black straight lines: kinematical axes of the material considered in each panel.
Current usage metrics show cumulative count of Article Views (full-text article views including HTML views, PDF and ePub downloads, according to the available data) and Abstracts Views on Vision4Press platform.
Data correspond to usage on the plateform after 2015. The current usage metrics is available 48-96 hours after online publication and is updated daily on week days.
Initial download of the metrics may take a while.