Fig. 4
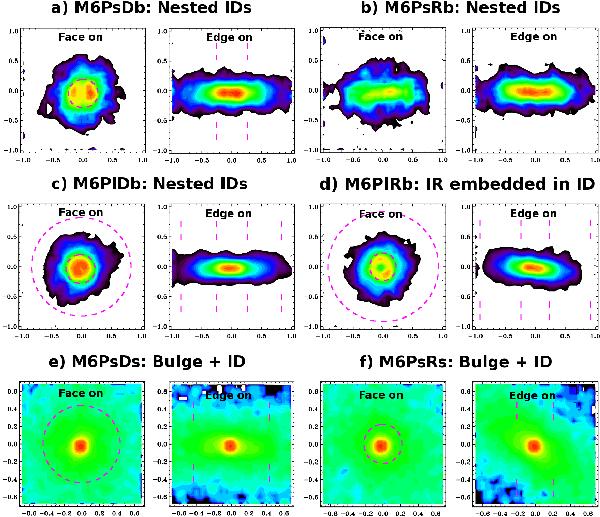
Morphology of the ICs made out of disrupted satellite stellar material resulting in models with mass ratio 1:6 (models a–f in Table 3). Surface density maps of the stars originally from the satellite in the final remnants are presented, using a face-on and an edge-on view (left and right columns in each model, respectively). A rainbow colour palette is used to represent different surface density levels on a logarithmic scale, with redder colours indicating higher values. The levels of the colour scale differ from panel to panel, as they have been set automatically to ensure an adequate sampling of the dynamical range of the surface density shown in each map. Spatial scales in both axes are provided in simulation units. The radial extent of each independent IC (i.e., characterized by an unique exponential profile, see Sect. 3.2.1) are marked with dashed lines in each map.
Current usage metrics show cumulative count of Article Views (full-text article views including HTML views, PDF and ePub downloads, according to the available data) and Abstracts Views on Vision4Press platform.
Data correspond to usage on the plateform after 2015. The current usage metrics is available 48-96 hours after online publication and is updated daily on week days.
Initial download of the metrics may take a while.