Fig. 1
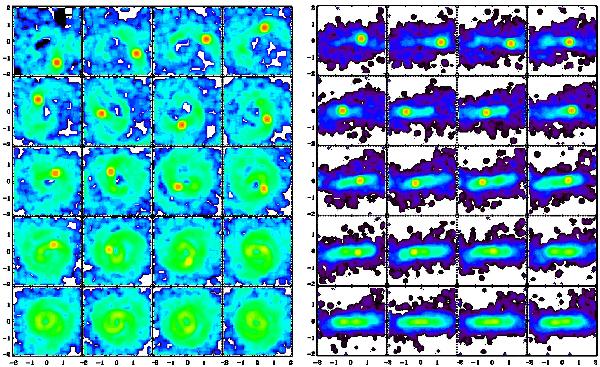
Time evolution of the luminous surface density of the satellite material during the last moments of experiment M18PsDb (experiment “i” in Table 3). Face-on and edge-on views centred on the initial primary galaxy are plotted (left and right panels, respectively). Snapshots corresponding to times from 101 to 120 are shown from up-to-down and left-to-right of each figure, using a time step equal to one. If the primary galaxy is scaled to the MW (see Sect. 2), the total time period represented corresponds to ~0.5 Gyr. A rainbow colour palette is used to represent different surface density levels in a logarithmic scale, with redder colours indicating higher values. Spatial scales in both axes are provided in simulation units. The disrupted satellite material is finally deposited in the remnant centre forming an IR (in yellow) embedded in a more extended ID (in green). The IR rotates in the same direction as the primary disc material.
Current usage metrics show cumulative count of Article Views (full-text article views including HTML views, PDF and ePub downloads, according to the available data) and Abstracts Views on Vision4Press platform.
Data correspond to usage on the plateform after 2015. The current usage metrics is available 48-96 hours after online publication and is updated daily on week days.
Initial download of the metrics may take a while.