Fig. 2
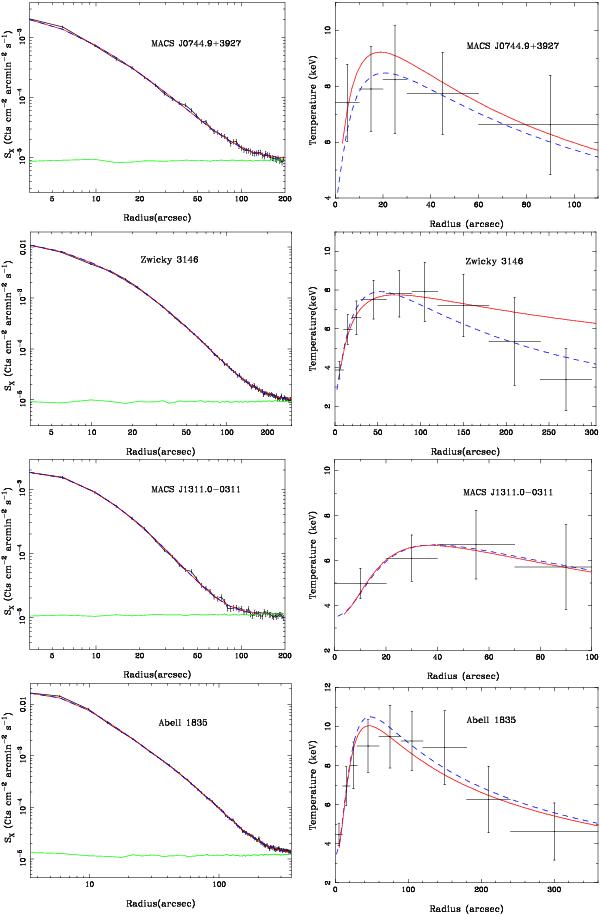
X-ray surface brightness (left column) and temperature profiles (right column) for the sample of eight relaxed galaxy clusters. The black points are derived from the X-ray image and spectroscopic data. The blue lines in both profiles show the best fit model to the data obtained using a uniform Anders & Grevesse (1989) helium abundance, and the red lines show the best fit model obtained using the Peng & Nagai (2009) helium sedimentation distribution; the green lines in surface brightness profiles indicate the background levels determined from the blank sky observations. The overall χ2 of the fits obtained from the uniform helium abundance and the helium sedimentation model (Tables 2 and 3) show that both distributions give equally good fits to Chandra data.
Current usage metrics show cumulative count of Article Views (full-text article views including HTML views, PDF and ePub downloads, according to the available data) and Abstracts Views on Vision4Press platform.
Data correspond to usage on the plateform after 2015. The current usage metrics is available 48-96 hours after online publication and is updated daily on week days.
Initial download of the metrics may take a while.