Fig. 9
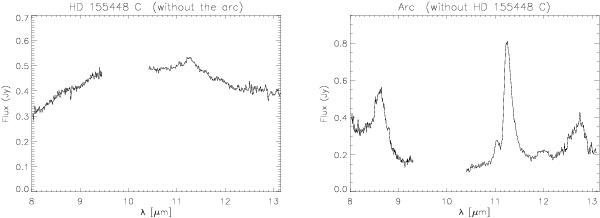
VISIR N band spectra. Left panel: HD 155448 C, showing a silicate feature. Right panel: the arc, with strong PAH bands at 8.6, 11.3, and 12.7 μm. The y-axis scale is not identical in both figures, but was adjusted to optimally show the features. The gap between approximately 9.5 μm and 10.3 μm is due to incomplete instrument coverage (see Appendix A.5.2).
Current usage metrics show cumulative count of Article Views (full-text article views including HTML views, PDF and ePub downloads, according to the available data) and Abstracts Views on Vision4Press platform.
Data correspond to usage on the plateform after 2015. The current usage metrics is available 48-96 hours after online publication and is updated daily on week days.
Initial download of the metrics may take a while.