Fig. 8
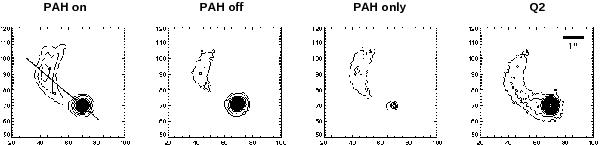
VISIR images in the PAH2 filter at 11.25 μm (“PAH on”), the continuum at 11.88 μm (“PAH off”), the difference of both previous images (“PAH only”), and in the Q2 filter at 18.72 μm. Only the C component is seen in the mid-IR narrow-band filters used. The VISIR slit orientation at 50° position angle is indicated in the left image (cf. also Fig. 3). To obtain optimal contour plots for the different intensity ranges, 50 equidistant contour levels were plotted for “PAH on” and “PAH off”, 5 contour levels for “PAH only”, and 20 levels for the Q2 image.

Current usage metrics show cumulative count of Article Views (full-text article views including HTML views, PDF and ePub downloads, according to the available data) and Abstracts Views on Vision4Press platform.
Data correspond to usage on the plateform after 2015. The current usage metrics is available 48-96 hours after online publication and is updated daily on week days.
Initial download of the metrics may take a while.