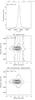
Fig. 7
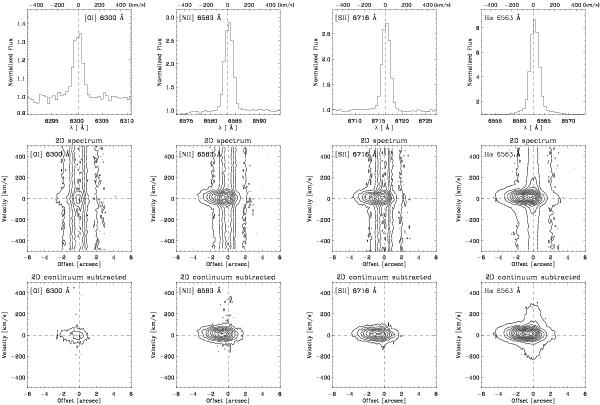
Important emission lines observed in HD 155448 C, extracted from spectra obtained in an east-west slit orientation. The upper panel displays the extracted spectral line, the middle panel shows the position-velocity diagrams in the raw 2D spectrum, while the lower panels expose the position-velocity diagrams after the subtraction of the continuum PSF. The first (outer) contour represents the 5σ level with respect to the background noise. Subsequent contours are at 10σ intervals, except for Hα, which is composed of 30σ intervals.
Current usage metrics show cumulative count of Article Views (full-text article views including HTML views, PDF and ePub downloads, according to the available data) and Abstracts Views on Vision4Press platform.
Data correspond to usage on the plateform after 2015. The current usage metrics is available 48-96 hours after online publication and is updated daily on week days.
Initial download of the metrics may take a while.