Free Access
Fig. 2
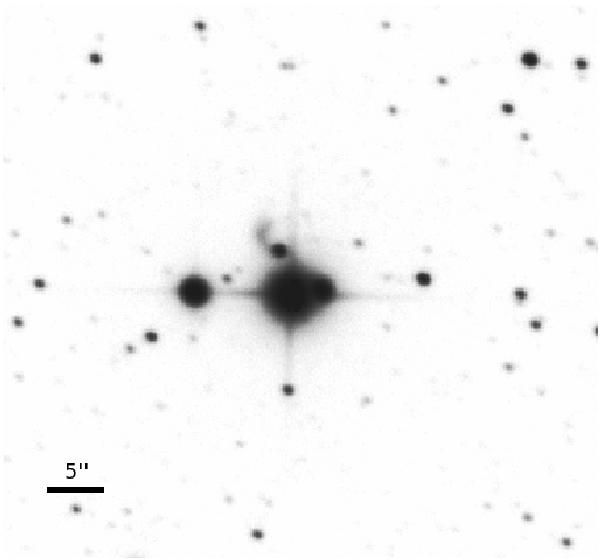
EFOSC2 R band image. The cut levels were adjusted to also display the arc northeast of the C component, which may give the wrong impression that components A and B were not resolved. See Fig. 1 for an identification of the components.
Current usage metrics show cumulative count of Article Views (full-text article views including HTML views, PDF and ePub downloads, according to the available data) and Abstracts Views on Vision4Press platform.
Data correspond to usage on the plateform after 2015. The current usage metrics is available 48-96 hours after online publication and is updated daily on week days.
Initial download of the metrics may take a while.