Fig. 8
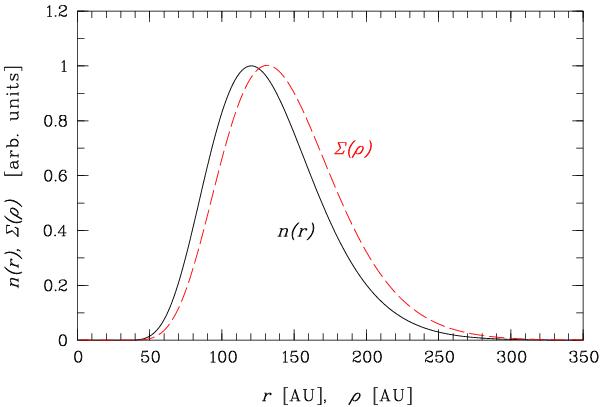
Volume density distribution n(r) over the radial distance r from the star and surface density distribution Σ(ρ) over the distance ρ from the star projected on the disk midplane for our best-fit model (parameters see Table 3). The analytical functions for n(r) and Σ(ρ) transform into each other following Eq. (4). Both distributions are given in arbitrary units and scaled to a peak height of one for each distribution so that they can easily be compared. The peak particle density is 8.03 × 10⁻⁶ m-3, while the peak surface density amounts to 2.64 × 10⁷ m-2.
Current usage metrics show cumulative count of Article Views (full-text article views including HTML views, PDF and ePub downloads, according to the available data) and Abstracts Views on Vision4Press platform.
Data correspond to usage on the plateform after 2015. The current usage metrics is available 48-96 hours after online publication and is updated daily on week days.
Initial download of the metrics may take a while.