Free Access
Fig. 12
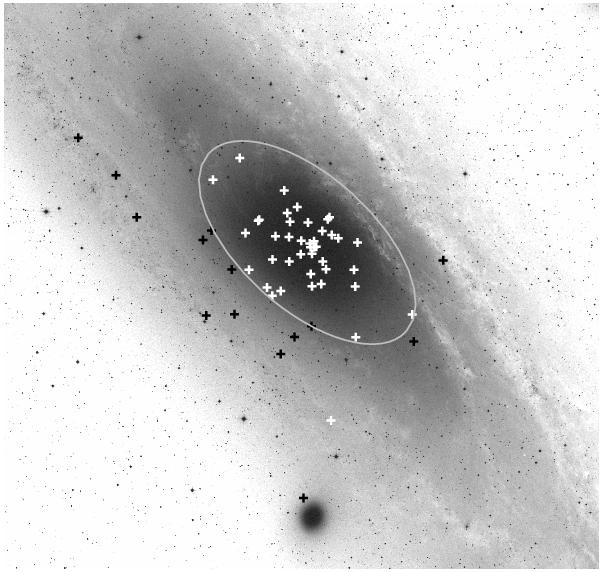
Location of the M 31 old (white) and young novae (black) overlaid on a DSS2-R image. The grey ellipse marks the boundary between the M 31 bulge and the disk that was used in this work. See Sect. 5.5 for an explanation of the classification. Only four of the 60 nova SSSs from Table 9 are outside this image.
Current usage metrics show cumulative count of Article Views (full-text article views including HTML views, PDF and ePub downloads, according to the available data) and Abstracts Views on Vision4Press platform.
Data correspond to usage on the plateform after 2015. The current usage metrics is available 48-96 hours after online publication and is updated daily on week days.
Initial download of the metrics may take a while.