Fig. 4
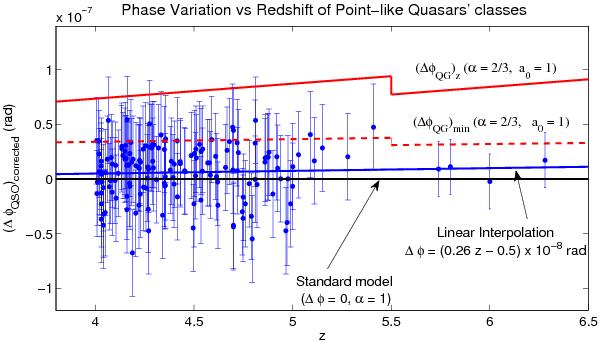
Corrected phase variations of QSOs as a function of the redshift z. No blurring effects due to QG are observed. The linear interpolation of all the data sets show a positive trend, indicating the possible resolvability of the sources – blue solid line (color online). The red (color online) continuous and dashed “z”-shaped lines represent the expected growth of the phase variation, Δφ, as a function of the redshift z. The break of the two curves indicating the limits of QG effects with (red solid line) and without cosmological redshift corrections (red dashed line), are due to the change of filters, F775W and F850LP.
Current usage metrics show cumulative count of Article Views (full-text article views including HTML views, PDF and ePub downloads, according to the available data) and Abstracts Views on Vision4Press platform.
Data correspond to usage on the plateform after 2015. The current usage metrics is available 48-96 hours after online publication and is updated daily on week days.
Initial download of the metrics may take a while.