Fig. 2
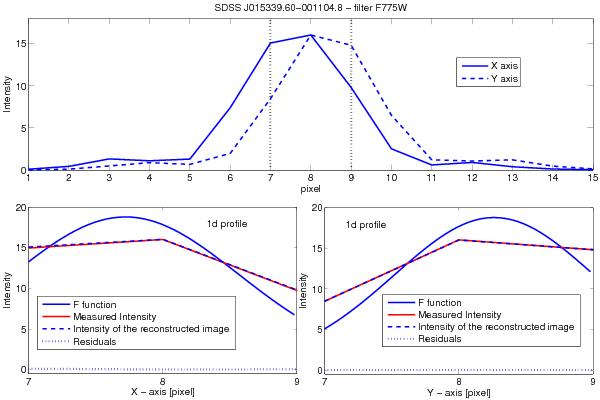
Top: 1d cut along the x-axis (solid line) and the y-axis (dashed line) of the measured intensity of QSO SDSS J015339.60-001104.8. We analyzed the area within the two dotted lines. Bottom: we show the measured intensity (red line), the interpolated function F (solid blue line), the intensity of the reconstructed image (dashed blu line), and the residuals (dotted blue line) of the 1d cut along the x-axis (left) and the y-axis (right) of the central area (3 × 3 pixels).
Current usage metrics show cumulative count of Article Views (full-text article views including HTML views, PDF and ePub downloads, according to the available data) and Abstracts Views on Vision4Press platform.
Data correspond to usage on the plateform after 2015. The current usage metrics is available 48-96 hours after online publication and is updated daily on week days.
Initial download of the metrics may take a while.