Fig. 1
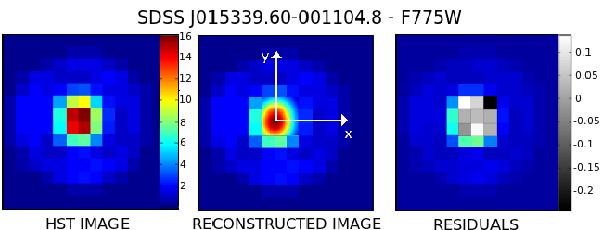
Left: HST image of the QSO QSO 0153-0011, IAU name SDSS J015339.60-001104.8 located at z = 4.205. The field of view is 15 × 15 pixels. Center: we show the central region (3 × 3 pixels) reconstructed using the function F (Eq. (10)). We plot the cartesian axes centered on the maximum of the intensity pattern. Here ϵ = 0.23 and α = 0.14 rad. Each pixel of the analyzed area is divided into 15 × 15 sub-pixels. Right: we show the residuals of the central analyzed area (3 × 3 pixels).
Current usage metrics show cumulative count of Article Views (full-text article views including HTML views, PDF and ePub downloads, according to the available data) and Abstracts Views on Vision4Press platform.
Data correspond to usage on the plateform after 2015. The current usage metrics is available 48-96 hours after online publication and is updated daily on week days.
Initial download of the metrics may take a while.