Fig. 9
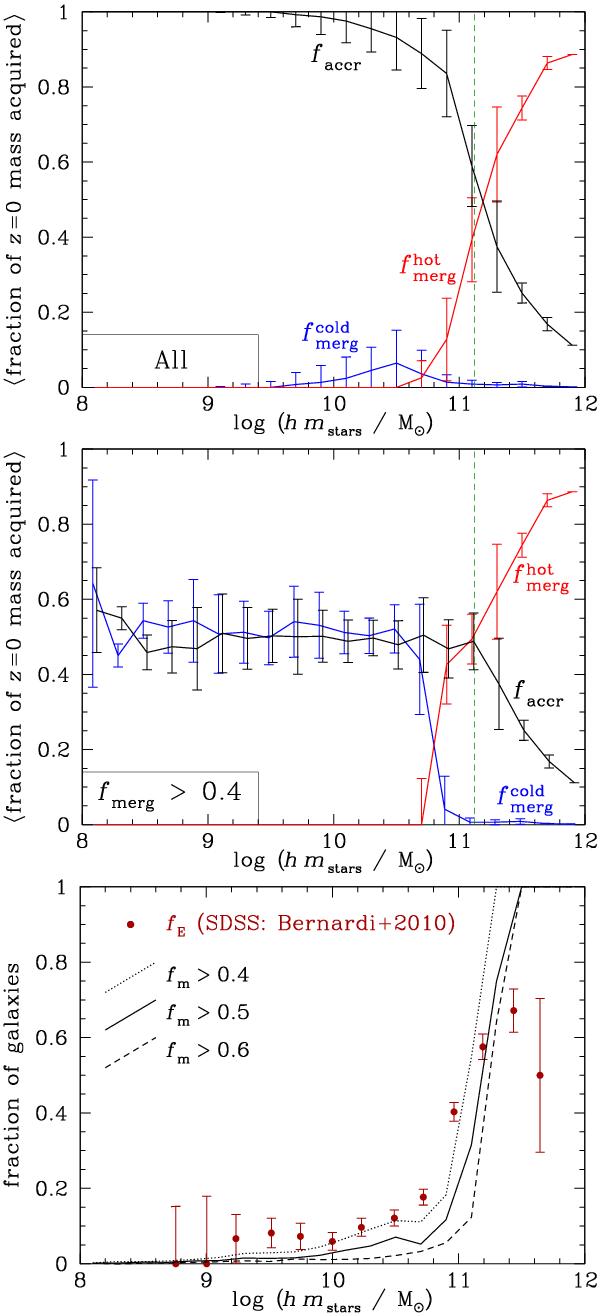
Top: median mass fraction at z = 0 acquired via gas accretion (black line), “cold mode” galaxy mergers within haloes with  (blue line), or “hot-mode” ones within haloes with
  (red line). Error bars show the interquartile range. The green vertical dashed line shows the baryonic mass mcrit = fbMshock. Middle: same as top panel, but for galaxies with fmerg ≥ 0.4 (comparable to ellipticals, see next panel). Bottom: fraction of galaxies with fmerg ≥ fm for fm = 0.4, 0.5, and 0.6. The dark red circles show the fraction of ellipticals, as visually classified by Fukugita et al. (2007) from SDSS images, as a function of stellar mass, as presented by Bernardi et al. (2010, middle right panel of their Fig. 12).
Current usage metrics show cumulative count of Article Views (full-text article views including HTML views, PDF and ePub downloads, according to the available data) and Abstracts Views on Vision4Press platform.
Data correspond to usage on the plateform after 2015. The current usage metrics is available 48-96 hours after online publication and is updated daily on week days.
Initial download of the metrics may take a while.