Fig. 5
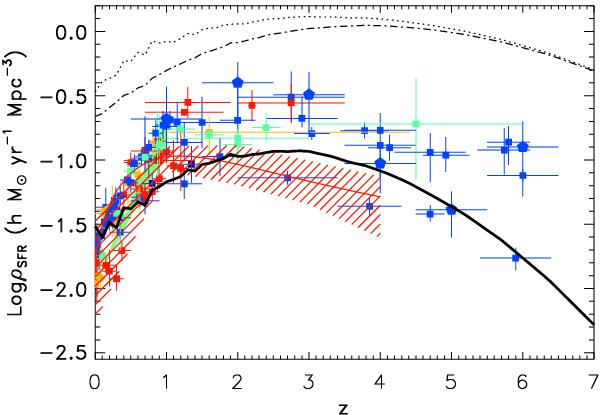
The evolution of the cosmic SFR density with redshift in the observed Universe (points with error bars and hatched region) and in our model (thick black solid line; the dotted and dotted-dashed lines correspond to the two models where baryons trace dark matter and without a low circular velocity cutoff, respectively, see Fig. 4b). The blue squares are UV data Giavalisco et al. (2004); Wilson et al. (2002); Massarotti et al. (2001); Sullivan et al. (2000); Steidel et al. (1999); Cowie et al. (1999); Treyer et al. (1998); Connolly et al. (1997); Baldry et al. (2005); Schiminovich et al. (2005); Wolf et al. (2003); Arnouts et al. (2005); Bouwens et al. (2003); Bouwens (2006); Bunker et al. (2004); Ouchi et al. (2004). The blue pentagons are Hubble Ultra Deep Field estimates (Thompson et al. 2006). The red squares are Hα, Hβ and OII data (Hanish et al. 2006; Pérez-González et al. 2003; Tresse et al. 2002; Hopkins et al. 2000; Moorwood et al. 2000; Sullivan et al. 2000; Glazebrook et al. 1999; Yan et al. 1999; Tresse & Maddox 1998; Gallego et al. 1995; Pettini et al. 1998; Teplitz et al. 2003; Gallego et al. 2002; Hogg et al. 1998; Hammer et al. 1997). The orange squares are 1.4 GHz data (Mauch & Sadler 2007; Condon et al. 2002; Sadler et al. 2002; Serjeant et al. 2002; Machalski & Godlowski 2000; Haarsma et al. 2000; Condon 1989). The orange pentagon at z ≃ 0.24 is X-ray data (Georgakakis et al. 2003). The green squares are infrared (Pérez-González et al. 2005; Flores et al. 1999) and sub-mm (Barger et al. 2000) data. The green hatched region is the far infrared (24 μm) SFR history from Le Floc’h et al. (2005). Most of them were taken from the compilations in Hopkins (2004) and Hopkins & Beacom (2006). The red curve,  , is the cosmic SFR derived by Wilkins et al. (2008) by taking the derivative of the cosmic stellar mass density, i.e. from the variation of the observed stellar mass functions with z rather than from star formation rate measurements. The red shaded area shows the margins of uncertainty around the red curve. All observational data have been corrected (–0.15 dex) to the diet Salpeter IMF assumed by Bell et al. (2003), on whose mass function we have calibrated our model.
Current usage metrics show cumulative count of Article Views (full-text article views including HTML views, PDF and ePub downloads, according to the available data) and Abstracts Views on Vision4Press platform.
Data correspond to usage on the plateform after 2015. The current usage metrics is available 48-96 hours after online publication and is updated daily on week days.
Initial download of the metrics may take a while.