Fig. 1
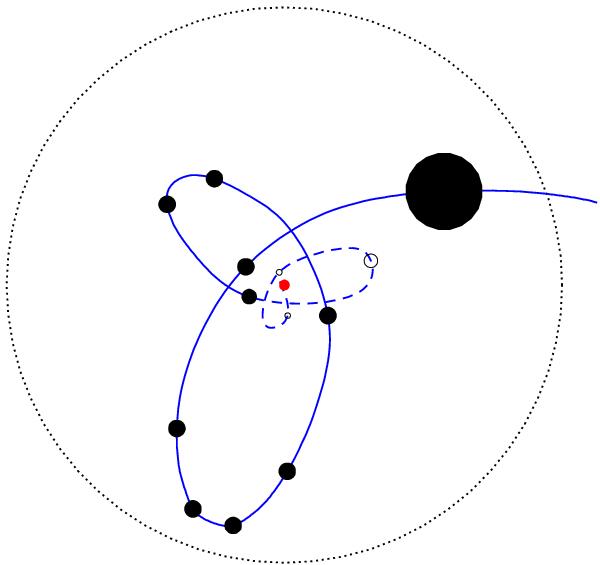
Sketch illustrating the merger of two haloes. Once the smaller halo penetrates the larger one (whose central galaxy is denoted by a red circle), it becomes a sub-halo. Its orbit (adapted from an N-body simulation by Colpi et al. 1999), shown by the blue curve (with positions shown for equal timesteps), decays by dynamical friction and its size, shown by the circles, is reduced by tidal stripping from the larger halo’s potential. The solid part of the blue curve is followed directly by the N-body simulation, while the dashed part shows the trajectory that the sub-halo is expected to take after it (open circles) is no longer resolved in the simulation. In our analysis, the duration of the motion along the dashed stretch of the blue curve is computed analytically from Eqs. (1–3).
Current usage metrics show cumulative count of Article Views (full-text article views including HTML views, PDF and ePub downloads, according to the available data) and Abstracts Views on Vision4Press platform.
Data correspond to usage on the plateform after 2015. The current usage metrics is available 48-96 hours after online publication and is updated daily on week days.
Initial download of the metrics may take a while.