Fig. 13
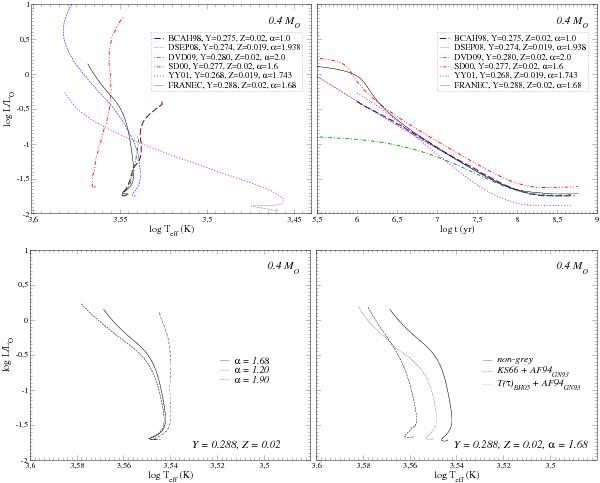
Upper panels: comparisons of 0.4 M⊙ tracks from different authors listed in Table 2 for Z ≈ 0.02, in the HR diagram and in the (log t (yr), log L/L⊙) plane. Bottom left panel: 0.4 M⊙ models computed with three values of the mixing length parameter, namely α = 1.2,1.68, and 1.9. Bottom right panel: 0.4 M⊙ models with three different choices of the adopted boundary conditions: non-grey models as described in Sect. 2.2 (solid line), KS66 T(τ) relation plus AF94 low-temperature opacity tables (dashed line) and T(τ) relation interpolated from the Brott & Hauschildt (2005) atmosphere models plus AF94 low-temperature opacity tables (dotted line).
Current usage metrics show cumulative count of Article Views (full-text article views including HTML views, PDF and ePub downloads, according to the available data) and Abstracts Views on Vision4Press platform.
Data correspond to usage on the plateform after 2015. The current usage metrics is available 48-96 hours after online publication and is updated daily on week days.
Initial download of the metrics may take a while.