Fig. 2
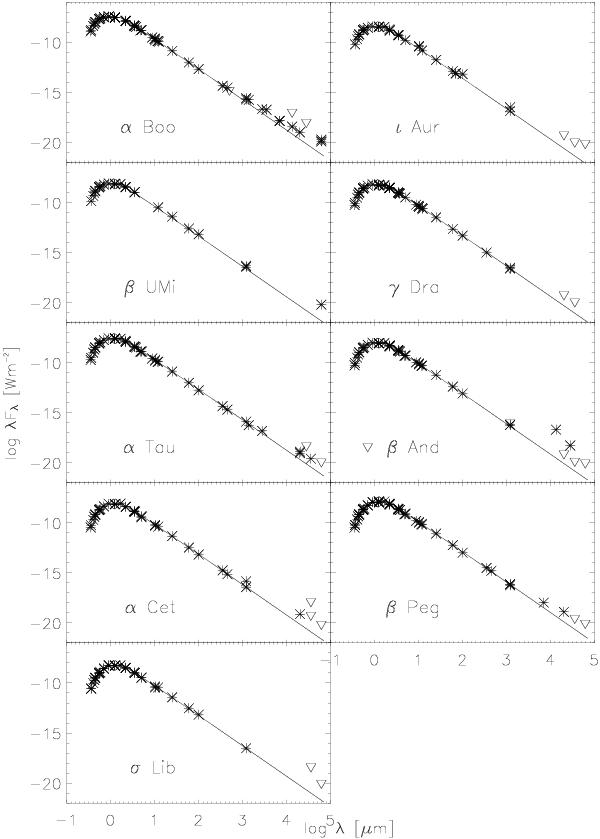
Comparison between the photometric data (asterisks) and the continuum theoretical spectrum (full line) for the nine sample stars. If several observations are available at the same wavelength, only the maximum and minimum flux value were plotted, except at (sub)millimetre and centimetre wavelengths as this wavelength region is of particular interest here. Most of the error bars fall within the symbols for the data. A reversed triangle represents an upper limit.
Current usage metrics show cumulative count of Article Views (full-text article views including HTML views, PDF and ePub downloads, according to the available data) and Abstracts Views on Vision4Press platform.
Data correspond to usage on the plateform after 2015. The current usage metrics is available 48-96 hours after online publication and is updated daily on week days.
Initial download of the metrics may take a while.