Fig. 23
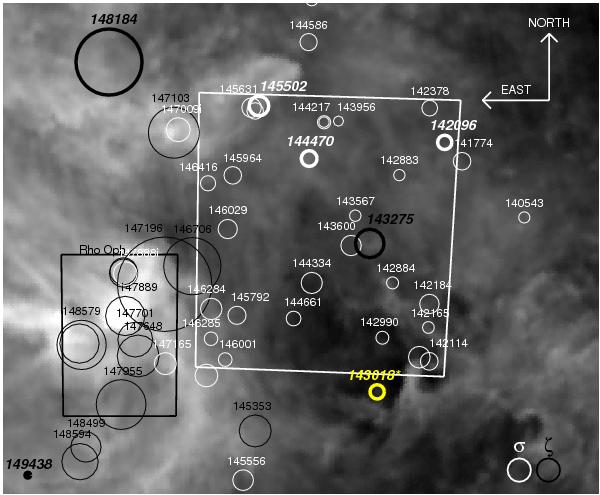
The circle sizes is proportional to Wλ(5797)/Wλ(5780). Black and white circles indicate ζ and σ sightlines, respectively. Seven of the eight stars (one is outside the map) generating 90% of the local ISRF (Sujatha et al. 2005) are indicated by bold circles with italic numbers. The “high-density” (ρ Oph cloud) and “low-density” regions selected for comparison are delineated by the black and white square, respectively. Intermediate classified lines-of-sight are labeled with an “i”. Note that for HD 149438 no DIBs were detected, but it is included here for its large contribution to the local ISRF. Targets labeled with “*” have relative errors on the ratio between 30 and 60%, while errors larger than 60% are omitted. All other targets have errors smaller than 30% (see also Table 2).
Current usage metrics show cumulative count of Article Views (full-text article views including HTML views, PDF and ePub downloads, according to the available data) and Abstracts Views on Vision4Press platform.
Data correspond to usage on the plateform after 2015. The current usage metrics is available 48-96 hours after online publication and is updated daily on week days.
Initial download of the metrics may take a while.