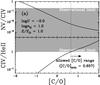
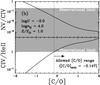
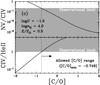
Fig. 3
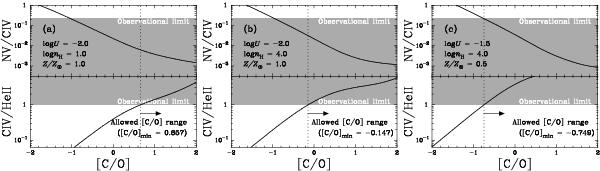
Solid lines show the predicted dependencies of the N v/C iv and C iv/He ii flux ratios on the carbon relative abundance [C/O]. The panels a), b), and c) show models with (nH, U, ZNLR/Z⊙) = (101.0, 10-2.0, 1.0), (104.0, 10-2.0, 1.0), and (104.0, 10-1.5, 0.5), respectively. The gray shadows denote the ranges that are consistent withe observational limits on the N v/C iv and C iv/He ii flux ratios in TN J0924−2201. The allowed [C/O] range is shown as the dotted line and arrow. The minimum carbon relative abundance ([C/O]min) for each model is also given in each panel.
Current usage metrics show cumulative count of Article Views (full-text article views including HTML views, PDF and ePub downloads, according to the available data) and Abstracts Views on Vision4Press platform.
Data correspond to usage on the plateform after 2015. The current usage metrics is available 48-96 hours after online publication and is updated daily on week days.
Initial download of the metrics may take a while.