Fig. 5
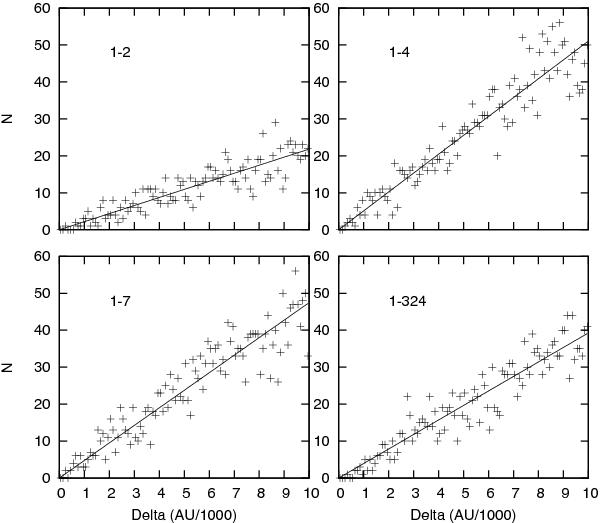
Probability density of the close encounters for the pairs 1–2, 1–4, 1–7, 1–324. All approaches closer than 0.01 AU are collected in bins of 0.0001 AU. The number of hits in each bin is plotted versus the distance of closest approach Δ (in AU/1000). The solid line is the linear fit to this data, which provides, after normalization, the probability density function for the close approaches (Table 3).
Current usage metrics show cumulative count of Article Views (full-text article views including HTML views, PDF and ePub downloads, according to the available data) and Abstracts Views on Vision4Press platform.
Data correspond to usage on the plateform after 2015. The current usage metrics is available 48-96 hours after online publication and is updated daily on week days.
Initial download of the metrics may take a while.