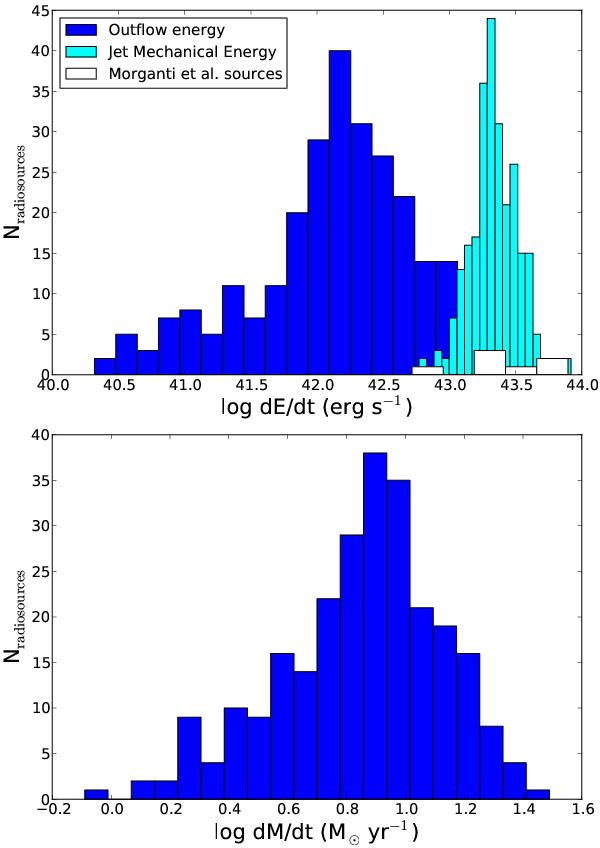
Fig. 4

Blue histograms show the energy (top) and mass (bottom) outflow rates estimated for our sources with robust NaD detections, given a flow radius of 1 kpc for all sources. The estimated jet mechanical power is represented by the aqua histogram in the top panel, which can be compared with that of radio sources with H i absorption detections (white; Morganti et al. 2005a). The jet power estimates would be about an order of magnitude greater if we used the relationship from Cavagnolo et al. (2010).
Current usage metrics show cumulative count of Article Views (full-text article views including HTML views, PDF and ePub downloads, according to the available data) and Abstracts Views on Vision4Press platform.
Data correspond to usage on the plateform after 2015. The current usage metrics is available 48-96 hours after online publication and is updated daily on week days.
Initial download of the metrics may take a while.


