Free Access
Fig. 1
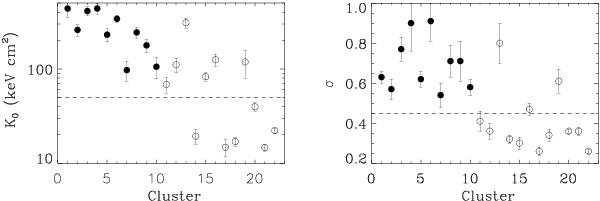
Cool-core indicators (K0 and σ) for all clusters in the sample. Filled symbols are “radio-halo” clusters, while open symbols are “radio-quiet”. Dashed lines mark the threshold between CC (below) and NCC (above). The numbering on the “x” axis refers to the position of the objects in Table 1. Error bars are 1σ.
This figure is made of several images, please see below:
Current usage metrics show cumulative count of Article Views (full-text article views including HTML views, PDF and ePub downloads, according to the available data) and Abstracts Views on Vision4Press platform.
Data correspond to usage on the plateform after 2015. The current usage metrics is available 48-96 hours after online publication and is updated daily on week days.
Initial download of the metrics may take a while.