| Issue |
A&A
Volume 532, August 2011
|
|
|---|---|---|
| Article Number | A101 | |
| Number of page(s) | 10 | |
| Section | Catalogs and data | |
| DOI | https://doi.org/10.1051/0004-6361/201117282 | |
| Published online | 01 August 2011 | |
Lunar occultations of 184 stellar sources in two crowded regions toward the Galactic bulge⋆
1
National Astronomical Research Institute of Thailand, 191 Siriphanich Bldg., Huay Kaew Rd., Suthep, Muang, Chiang Mai 50200, Thailand
e-mail: This email address is being protected from spambots. You need JavaScript enabled to view it.
2
Graduate Institute of Astronomy, National Central University, 300 Jhongda Road, Jhongli 32054, Taiwan
3
Department of Physics, National Central University, 300 Jhongda Road, Jhongli 32054, Taiwan
4
Departament Astronomia i Meteorologia and Institut de Ciències del Cosmos (ICC), Universitat de Barcelona (UB/IEEC), Martí i Franqués 1, 08028 Barcelona, Spain
5
Observatori Fabra, Camí de l’Observatori s/n, 08035 Barcelona, Spain
Received: 18 May 2011
Accepted: 17 June 2011
Abstract
Context. Lunar occultations (LO) provide a unique combination of high angular resolution and sensitivity at near-infrared wavelenghts. At the ESO Very Large Telescope, it is possible to achieve about 1 milliarcsecond (mas) resolution and detect sources as faint as K ≈ 12 mag.
Aims. We have taken advantage of a passage of the Moon over two crowded and reddened regions in the direction of the inner part of the Galactic bulge to obtain a high number of occultation light curves over two half nights. Our goal was to detect and characterize new binary systems, and to investigate highly extincted and relatively unknown infrared sources in search of circumstellar shells and similar peculiarities. Our target list included a significant number of very late-type stars, but the majority of the sources was without spectral classification.
Methods. An LO event requires the sampling of the light curve at millisecond rates to permit a detailed study of the diffraction fringes. For this, we used the so-called burst mode of the ISAAC instrument at the Melipal telescope. Our observing efficiency was ultimately limited by overheads for telescope pointing and data storage to about one event every three minutes.
Results. We could record useful light curves for 184 sources. Of these, 24 were found to be binaries or multiples, all previously unknown. The projected separations are as small as 7.5 mas, and the magnitude differences as high as ΔK = 6.5 mag. Additionally we could also establish for the first time the resolved nature of at least two more stars, along with an indication of circumstellar emission. We were also able to put upper limits on the angular size of about 165 unresolved stars, an information that combined with previous and future observations will be very helpful in establishing a list of reliable calibrators for long baseline interferometers.
Conclusions. Many of the newly detected companions are beyond the present capabilities of other high angular resolution techniques, but some could be followed up by long baseline interferometry or adaptive optics. From estimates of the stellar density we conclude that statistically the influence of chance alignments appears to be negligible. We infer that most cases are probably giant-dwarf pairs.
Key words: techniques: high angular resolution / occultations / binaries: general / stars: fundamental parameters / infrared: stars / circumstellar matter
Based on observations made with ESO telescopes at Paranal Observatory.
On leave from European Southern Observatory, Karl-Schwarzschild-Str. 2, 85748 Garching bei München, Germany.
© ESO, 2011
1. Introduction
Lunar occultations (LO) are simple, economic, time efficient, and they provide high angular resolution far exceeding the diffraction limit of any single telescope. Indeed, the resolution of an LO is matched at present only by long-baseline interferometry (LBI), which, however, is far from being simple, economic or time efficient. At a large telescope, LO also offer a superior sensitivity. Clearly, LO have significant limitations of their own, in particular they are fixed time events of sources selected randomly by the apparent lunar motion. Another important limitation is that a single LO event only provides information along the direction of the limb motion, i.e. it is intrinsically one-dimensional. This can be overcome if more events of the same source are observed, either from different locations or in the course of different lunar passages. Admittedly, this is difficult to achieve if a large telescope is to be employed. On the other hand, a significant bonus of the LO technique is the possibility to apply statistical methods that yield the actual brightness profile and not just a diameter or a binary separation. This makes LO ideal for studying sources with complex geometries.
Given the characteristics and limitations of LO, this method is best suited for routine observations of large samples of targets with the aim of serendipitous detections of binary stars and resolved sources. At a large telescope where observing time is precious, there are essentially two ways to implement this strategy: wait for favorable episodes in which the Moon covers a large number of sources in a brief period of time (see Richichi et al. 2008a,b), or obtain small chunks of observing time whenever they become available (see Richichi et al. 2010). These three latter references (Paper I to Paper III, respectively) include a detailed description of how the LO method has been implemented at the ESO Very Large Telescope (VLT), both in terms of instrumental solutions, of observational strategy, of data reduction, and of performance. Thus, in the present paper we will linger only very briefly on these aspects, and concentrate instead on the results and the conclusions.
2. Observations and data deduction
Following the strategy of maximum return for minimum observing time, we observed the passage of the Moon over two crowded regions rich in near-infrared sources during the two first half nights of September 25 and 26, 2009. As in the previous papers we used ISAAC, this time at the Melipal telescope (UT3). The instrument was operated in burst mode, reading out a 32 × 32 pixels ( × ) subwindow with a time sampling of 3.2 ms, which was also the effective integration time. We used mostly sequences of 5000 frames, or 16 s, per star. In a few cases we chose slightly shorter or longer sequences to manage situations of occultations very close to each other in time, or cases of two sources occulted within the same field of view (see Sect. 3.3). A broadband K-short filter was employed for most of the sources, except for three bright stars for which we used a narrowband filter centered around 2.07 μm to avoid saturation. All events were disappearances, with a lunar phase of about 49% and 59% in the two nights. The seeing was generally good with extremes of
  and
and  , and we could follow the Moon to a maximum airmass of 2.8. Over the two nights, we recorded 202 events in about 9.5 h, but a small fraction of data proved to be unusable, and in practice we have a total of 184 confirmed light curves. Using the magnitudes from the 2MASS Catalogue, the brightest and faintest star had K = 2.7 and 10.9 mag respectively. A summary of the main statistics of the sample is given in Table 1, while a detailed list is provided in Table 2, which follows the same style as Paper III, with the addition of the signal-to-noise ratio (SNR) and of the limiting magnitude corresponding to SNR = 1. We stress, however, that the SNR is computed over the whole light curve, and there might be variations as a function of time. For example, the portion of the light curve with the unocculted star can have slow fluctuations or other signal-related features. Also, the likelihood of detection of a binary for a given separation and brightness ratio is not symmetric around the central star (Richichi et al. 1996). The limiting magnitude is based on the 2MASS magnitude, which may not be correct in the presence of variability (Sect. 3.4). Finally, we stress that it is possible to detect companions with an intensity formally below SNR = 1, provided that a long section of stable photometry is available.
Statistics of observations.
The process of extracting LO light curves from the burst mode data cubes and the corresponding analysis has already been described, particularly in Paper I. As before, we used two versions of the data analysis, both a model-dependent and model-independent one (ALOR and CAL respectively, Richichi et al. 1996; and Richichi 1989). Upper limits on the angular sizes of unresolved sources were computed using the approach described in Richichi et al. (1996). One significant innovation in our arsenal of data reduction tools is a method to deal with light curves that appear to exhibit a variable lunar rate, i.e., for which presumably the local limb slope is changing across the duration of the event. This effect is generally quite small, e.g., 1° or 2° over a few tenths of a second, but given the very high SNR of some of our data it is occasionally noticeable. This method, as well as other considerations on lunar limb effects, is part of a separate paper in preparation.
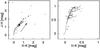 |
Fig. 1 Color–color diagram for the sources (dots) for which we recorded the LO events listed in Table 2. The left and right panels are for the nights of September 25 and 26, respectively. Note the different scales. The solid and dashed lines are the loci of the unreddened giant and dwarf stars, respectively, according to Bessell & Brett (1988). The arrow is the extinction vector for AV = 10 mag, according to Rieke & Lebofsky (1985). |
3. Results
The stars of the first night were clustered in a much more interior region of the bulge than those of the second night. The minimum angular distances from the Galactic center were just under 5° and almost 17° in the two cases. It is then no surprise that the stars occulted in the first night were in general much redder, as shown in Fig. 1. Evidently, there the reddening can be well explained by general interstellar extinction, with AV of up to more than 15 mag. This is consistent with the map of general extinction in this area derived from dust infrared emission by Schlegel et al. (1998), which show levels of 6 ≲ AV ≲ 30 for our sources of the first night. On the second night, little or no reddening is observed and the average (J − K) colors are in line with the typical value of field stars, see Table 1. The table also shows that on the first night the occulted stars were on average significantly brighter than those of the second night: this is the result of the first region being much more crowded, and therefore giving us the opportunity to select occultations of brighter stars in the typical interval of 3 min. As mentioned in our previous papers, the number of occultation events to the sensitivity limit of K ≈ 12 mag far exceeds the practical possibilities of data recording, and we prioritized the events based on K brightness, near-IR colors, and source type and literature entries when available. We note that there is no overlap with the sources included in Papers I to III.
List of the recorded occultation events.
Summary of results.
The majority of the targets have near-IR colors consistent with those of giant or dwarf stars after making proper adjustments for extinction, but in few cases more peculiar colors are also observed. We will comment on these and on other cases where the reddening might have circumstellar origins later in this section. Owing to the reddening as well, the stars in our sample are generally faint or even undetected at visual wavelengths and are thus relatively poorly studied. Only about 7% have a spectral classification and about 16% have an entry in the Simbad database. Even for these, the available literature is generally very scarce.
In Table 3 we list the sources for which we found a positive result, either as a binary or multiple star or with a resolved angular diameter or with circumstellar emission. For ease of reference, the table is by right ascension and not by time of occultation. It follows a similar format and the same conventions as our previous papers. In summary, the columns list the value of the fitted linear rate of the event V, its deviation from the predicted rate Vt, the local lunar limb slope ψ, the position and contact angles, and the signal-to-noise ratio (SNR). For binary detections, the projected separation and the brightness ratio are given. The comments report the individual magnitudes of the components or, in the case of sources which are found to be extended, their approximate size. All angular quantities are computed from the fitted rate of the event.
We discuss first the sources that were found to be resolved and for which we can provide some context from existing literature, as well as those for which literature entries exist but which we found to be unresolved. We then discuss briefly those without any known cross-identification, and a few relatively wide pairs.
It should be already pointed out that many of the companions are faint, and indeed close to our detection limit. This can be justified, at least qualitatively, with arguments on the luminosity class. If, as we discuss at the end of Sect. 3.2, most of the companions are dwarf stars, we would expect their magnitude to fall indeed in the K ≈ 11 − 12 range. However, we do recognize that detections at the sensitivity limit are more subject to possible false events. This can be a problem especially in the case of LO, where repeated observations are rare. All our reported detections were selected first on the basis of the model-independent analysis, and then confirmed by inspecting the χ2 variations in a model-dependent analysis. Nevertheless, we are aware that mistakes can still be possible, as with all measurements close to the noise limit. We prefer to run the risk of a few possible erroneous detections than to risk ignoring some real ones. The reader can make use of the last columns in Table 2 to assess the robustness of each detection. Finally, we provide some considerations and general results on the statistics of detected binaries and on the unresolved sources. We do not show all light curves and their fits. Instead, we provide one example each for a binary, an unresolved and an extended source.
3.1. Sources with known cross-identifications
18022636-2555373 is HD 314951, a V = 9.8 mag star without bibliographical entries. Its colors suggest either a K5III or a slightly reddened K5V, placing this star in the foreground of our observed region. Figure 2 illustrates our detection both by a model-dependent and a model-independent approach, as used for all the binary stars in this paper.
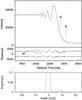 |
Fig. 2 Top: upper panel, data (solid) and best fit (dashed line) for 18022636-2555373. The lower panel shows, displaced by arbitrary offsets and enlarged for clarity, the residuals of the fits by a point-like (above) and by a binary star model including corrections due to slope variations (see text). The normalized χ2 values are 4.42 and 1.46, respectively. The times of the geometrical occultation of two stars are also marked, with their difference corresponding to a separation of 9.9 mas. Bottom: brightness profile reconstructed by the model-independent CAL method. |
18041207-2544225 is part of a  wide pair, as detailed in Sect. 3.3. The star to the south, 18041209-2544257, is brighter, with K = 5.59 mag, and unresolved with an upper limit of 0.50 ± 0.25 mas. It has reliable 2MASS photometric measurements in all JHK bands, and a position coincident with a WISE and a Spitzer detection, with [5.8] = 1310 mJy and [8.0] = 850 mJy. The northern star, 18041207-2544225, appears to be either marginally resolved with an angular diameter of 4.3 mas or, more likely, associated with faint extended emission. Its 2MASS fluxes are uncertain, because of its proximity to the bright star to the south. Its Spitzer fluxes [5.8] = 30 mJy and [8.0] = 15 mJy are also unreliable. IRAS detected only one source, 18010-2544 with [12] = 1178 mJy. If this flux came mostly from the southern source, then this star would have a mid-IR excess. We stress that the SNR of our LO observation of the northern component is low, ~18. Additional observations including spatially resolved near- and mid-IR photometry are needed to confirm and diagnose the nature of the extended emission.
18044848-2536204 is HD 164972, an F2-F3II or F3Ib star (De Medeiros et al. 2002). Its parallax of 2.28 ± 0.89 mas and the absence of significant reddening show it is in the foreground of our sample.
18054372-2514234 is the known bright near-infrared source IRC -30354. Its 2MASS colors, J − H = 1.35 and H − K = 0.62, and V magnitude of 13.5 are consistent with a highly reddened late-type dwarf (Hansen & Blanco 1975). The star exhibits a broad Hα line in emission (Velghe 1957). We detected two companions, with small projected separations that place the system at the limit of the resolution for adaptive optics (AO) on a very large telescope, and similarly the large magnitude differences make it challenging for LBI.
18060176-2526099 is IRC -30355, a bright infrared source. Its 2MASS colors are consistent with a late M giant, consistent with its spectral type of M6 determined by Hansen & Blanco (1975). Detected by AKARI, WISE, IRAS, Spitzer and MSX, it has a rising spectral energy distribution with prominent far-infrared excess. Our measurement shows an unresolved source in K-band with an upper limit of 0.40 mas.
18063774-2529277 is IRAS 18035-2529, an OH-IR source detected in the 1612 MHz OH maser line, with a typical double-peaked profile (te Lintel Hekkert 1991). It is also a prominent SiO maser source (Deguchi et al. 2004). We note that this star has extreme colors J − H = 2.57 and H − K = 3.25 but in fact the 2MASS J-band value is unreliable and the J − H could be even higher. At K = 9.0 mag this source could not provide a very high SNR by LO. Actually, our detected flux was rather consistent with K = 10.5 mag, indicating a significant variability that is not unexpected in this kind of source. Both model-dependent and model-independent fits to the data point to a resolved source. In the first case, a formal diameter of 12.7 ± 0.5 mas is derived. The model-independent analysis (Fig. 3) provides a better normalized χ2, however, and is also more consistent with the OH-IR scenario, showing a a central star with two asymmetric emission peaks at about 10 − 20 mas, which we attribute to the inner rim of a circumstellar shell.
18545320-2357035 was surveyed by Hipparcos and included as TYC 6860-1491-1 in the re-analysis that led to the Tycho Double Star Catalogue (Fabricius et al. 2002). That the multiplicity was not detected by Hipparcos is consistent with the its quoted performance. With V = 10.6 mag and with colors which do not show evidence of significant reddening, this star is probably in the foreground of our sample. We also mention a fainter, relative distant companion (see Sect. 3.3). This was not detected by Hipparcos because of its faintness.
18550997-2401055 is HD 175159, a star for which a LO was previously reported by Evans & Edwards (1983). As in our case, the star was found to be single by these authors.
18570946-2352076 and 18570922-2351582 are CD-24 14860B and HD 175601 respectively, and form a wide visual double system with separations ranging from  (epoch 1910) to
  (epoch 1998) (Dommanget & Nys 2002; Mason et al. 2001). Both stars were found unresolved by us.
18580265-2337079 is PPM 734659, a V = 9.9 mag star for which no literature entries are available. From the relatively bright visual counterpart, the unreddened colors and the high proper motion, we conclude that the star is in the foreground and the ΔK = 3.8 mag companion that we detect deserves further investigations for possible orbit determinations.
18594214-2342263 and 18594214-2342263 are AR Sgr and HD 176364, respectively. The former is a G4 star of RV Tau type classified as a very likely post-AGB object by Szczerba et al. (2007), while the latter is a G8IV star. In both cases our non-binarity detection confirms previous results from LO photoelectric observations (Evans & Edwards 1983; Radick et al. 1984).
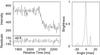 |
Fig. 3 Left: upper panel, data (solid) and best fit (dashed line) for 18063774-2529277. The lower panel shows the residuals of the fit by the profile shown to the right. The normalized χ2 is 1.21. Right: brightness profile reconstructed by the model-independent CAL method. |
18071398-2516474 is HD 315178, a known B-type star with a strong H-alpha line in emission (Merrill & Burwell 1950; Velghe 1957). From its 2MASS color, it obviously has an infrared excess and it was detected by MSX at 8 μm (Clarke et al. 2005). From our measurement we determine an upper limit on its K-band angular size of 1.95 mas.
18072725-2506165 is HD 165517, the optical counterpart of the X-ray source 1RXS J180725.9-250607. This O9.5:Ibe emission-line star has been classified also as B0:Ia by Johnston et al. (1994). With an estimated distance of 2.1 kpc (Kozok 1995) it is in the foreground of our sample. We do not detect any circumstellar emission and the source appears unresolved with an upper limit of 1.2 mas.
18073464-2534117 is HD 165530, a star with V = 8.3 mag and spectral type G7III that has colors consistent with those of a giant without any significant reddening. Indeed, the Hipparcos parallax places it at 340 pc albeit with a large error (HIP 88798). The fact that our newly detected companion was not revealed by Hipparcos is consistent with the performance limits of this latter (Mignard et al. 1995). We note that an inconsistency was found in the object type and literature references that the Simbad database associates to HD 165530. This is erroneously classified as a star in double system with a components separation of about  and linked to Gahm et al. (1983). By double-checking with archive images from several surveys, we noticed that the former reference is actually for HD 165530B, which effectively corresponds to the well-known WDS J18089-2528 double system with the above mentioned components separation.
A few more sources in our sample also have Simbad cross identifications, however without bibliographical entries of any relevance.
3.2. Resolved sources without known cross-identifications
The remaining entries in Table 3 have no known cross-identification in the Simbad database. They include an additional 17 new binaries and 2 new triples, with projected separations spanning the range 7 − 140 mas. Based on 2MASS, the primaries have K-band magnitudes ranging from 3.2 to 10.4, and the companions from 6.0 to 12.4. Thus, this sample of binaries represents a good hunting ground for follow-up studies. Although some of the sources might prove beyond the possibilities of present techniques, in many cases either AO or LBI should be able to detect and study the systems. The distribution in terms of projected separation and magnitude differences is shown in Fig. 4.
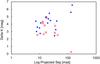 |
Fig. 4 Distribution of the secondary and tertiary companions in our sample, with respect to their respective primaries. The filled circles and empty squares represent the sources observed in the nights of Sep. 25 and 26, respectively. Note that our analysis did not extend beyond about |

We mention that 19010885-2317367 is of some interest: it has components of almost equal brightness and with a projected separation of  it should be quickly resolved with a variety of methods. Given that the source appears rather unreddened (J − H = 0.27, H − K = 0.11), it is probably a not too distant physical pair.
The large distances to many of our sources, as implied by their substantial interstellar reddening, and the relative crowding of the two regions pose the question of whether the binaries that we report are physical pairs or chance alignments. We have computed the average cumulative stellar density as a function of magnitude in the two areas. In the most crowded one, this amounts to 6.9 × 10⁻⁴ and 3.0 × 10⁻³ stars with K ≤ 10 and ≤ 12 mag respectively, per square arcsecond. We have verified this also by counting the stars with K ≤ 12.5 within 1′ radius around each of our targets, and we can exclude that clumpiness of the background stars plays any significant role at this spatial scale.
The ISAAC subwindow size is about 22 sq. arcsec, but our effective field of view was much smaller. In the direction of the lunar motion we only analyzed data equivalent to few  on the sky, because larger separations can be detected by conventional imaging. In the perpendicular direction, we were limited by the extraction mask which is typically less than half of the subwindow. Although these quantities vary for each event, our effective field of view was in practice ≲ 1 sq. arcsec. Therefore, we do not expect any significant fraction of chance associations in our sample. The probability of finding companions such as those listed in Table 3 is on average 0.1% in the first night, and even less in the second night.
The distribution of Fig. 4 is dominated by rather high brightness ratios, with an almost complete lack of pairs with ΔK < 2. One likely explanation is that in our selection of the ~200 events to be recorded among the tens of thousands occurring in the two half-nights to our sensitivity limit, we have naturally been biased toward the brighter ones. This has probably resulted in most of our targets being giant stars, and it is likely that their companions are main-sequence stars, thus explaining the high brightness ratios. For illustration, a K5 giant at 1 kpc with AK = 0.5 has an expected apparent magnitude K ≈ 7. More speculations are difficult, given that very little is known on the spectral types, visual magnitudes, and distances.
We also note that for some of the triples, the separation ratios are not hierarchical. However, we recall that we can only measure projected separations and in any case the statistics are simply too small to warrant further discussions. For all these reasons, follow-up studies are very desirable.
3.3. Wide binaries
In six cases, our acquisition images showed two sources present in the same × field of view. By proper positioning in the subwindow and adjustment of the number of frames we could record occultation events for both. They were all observed in the broadband K-short filter. These pairs are unresolved by 2MASS and therefore only one set of J, H, K magnitudes is available, with the exception of the pair 18041209-2544257 and 18041207-2544225 already discussed in Sect. 3.1, for which, however, the 2MASS magnitudes of the fainter star are unreliable. From our LO analysis we could derive an accurate brightness ratio in the K-band for all these pairs, from which we deduce the individual K-band magnitudes using the 2MASS total value. For the above 2MASS-resolved pair, we adopted the 2MASS magnitude for the brighter source and derived that of the fainter one from its counts.
To compute separation and position angle (PA) values, an average image was created from the occultation frames, and two-dimensional Gaussian PSF fitting (Bertin & Arnouts 1996) was used to find precise positions for the binary components. By comparing values obtained with different centroiding algorithms, we estimate accuracies of better than  and 1° for separation and PA, respectively. The parameters for these wide pairs are listed in Table 4. The suffixes 1 and 2 are in order of disappearance and not of brightness. In Table 2 we can report only the total J and H magnitudes for each pair. Note that some of the individuals components of these wide pairs were additionally found to be resolved, binary or triple as already reported above.
With the exception of one, already mentioned in Sect. 3.1, these wide pairs have no known-cross identifications and it is difficult to assess whether they are physical. At least those from the first night all show significant reddening from their location in Fig. 1, with AV ranging from ≈ 2 to ≈ 10. This places them at distances of some kpc: if they were physical pairs, their separations would significantly exceed 103 AU. We note that with the exception of the last star in Table 4, which is also the one with the least red colors and probably in the foreground of our sample, all these wide pairs also exhibit quite high brightness ratios. Especially for those in the first night, they show a primary-secondary distribution similar to that of the close pairs, in line with our arguments at the end of Sect. 3.2.
Parameters for the wide pairs.
3.4. Unresolved sources, variability and performance
As in previous papers, we used the χ2-based procedure described in Richichi et al. (1996) to assess whether a source was unresolved, and determine an upper limit on its angular size. These upper limits vary with SNR, being on average 2.2 mas and reaching 0.25 mas in the best case. This was computed for 165 sources, but we note that we did not include the individual components of binaries and multiples in this count.
An example of a source established to be unresolved is given in Fig. 5, for 18012777-2538123 observed under average seeing conditions in the first night. This source has no known cross-identifications or literature entries. With K = 6.6 it falls close to the median brightness of our sample, and with SNR = 110 it is representative of a good data quality, although this is by no means exceptional: our sample includes many cases of better SNR, up to about 300. The (J − K) = 1.8 is consistent with the average color of the sample and suggests no intrinsic reddening. Figure 5 shows the fit with a point-like source, with a normalized χ2 = 1.013. We compute an upper limit of 0.75 ± 0.30 mas. For comparison, a fit with a 2 mas model increases the normalized χ2 by 12.5%.
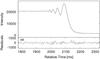 |
Fig. 5 Same as the left side of Fig. 3, for 18012777-2538123 with an upper limit on the angular size of 0.75 mas. The residuals are enlarged and the normalized χ2 is 1.01. More details in Sect. 3.4. |
So far we have adopted the 2MASS K-band magnitudes at face value, but we should now comment that these might occasionally be inaccurate in two respects. Firstly, by converting our observed counts to a K-band magnitude using the ISAAC specific response, we notice that about 9% of the sources are up to 1 mag brighter than the 2MASS values, and about 17% are at least 0.3 mag and up to almost 2 mag fainter. We assume here that up to 0.3 mag dimming could be caused by airmass and our masking process. Consequently, variability is an important factor, which is perhaps not surprising when we consider that most of the sources are probably late-type giants. Indeed, the most extreme case of flux deficit is that of 18063774-2529277 already commented in Sect. 3.1. Secondly, some of the 2MASS magnitudes are flagged as unreliable, owing to the presence of a nearby bright star, for example. This applies to three of the most extreme points in Fig. 1, namely 18063720-2514416 with J − H = 4.00 and H − K = −0.10, 18043132-2527356 (2.80, 0.87) and 18024090-2552007 (1.35, 2.20).
In Papers I to III we have already reported details on the performance of sensitivity and angular resolution of the LO method at the ESO VLT. Without more figures we state here that we confirm also for the present data an angular resolution ranging from ≈0.5 mas for SNR > 100 to ≈5 mas for SNR ≈ 10. These SNR values are typically achieved for K-band magnitudes of ≈5 and ≈10, respectively. A comparison with the early predictions on LO performance at a very large telescope using subarrays (Richichi 1994) shows that a significant improvement could still be gained in sensitivity by using instruments with a pixel size matching the seeing disk.
We also note that adding to the previous statistics reported in Papers I to III, we now have a database of about 350 unresolved stars with reliable upper limits as small as 0.25 mas, determined in a consistent fashion using LO at the VLT. The range of magnitudes and of sizes represents an ideal catalog of calibrators for near-IR LBI, to which we can add the substantial number of resolved and binary stars that were not previously known and that can be likewise flagged as unsuitable calibrators. This database is still increasing thanks to further observations currently under analysis, and we plan to publish it in the near future.
4. Conclusions
Using the LO technique with the ISAAC instrument at the ESO VLT, we have carried out milliarcsecond resolution observations of 184 sources in two crowded regions toward the Galactic bulge. The stars in the first of these two regions were as close as 5° from the Galactic Center and exhibited very significant interstellar extinction. The second region was farther away and less extincted. While most of the sources had colors that could be reconciled with reddened dwarf or giant late-type stars, some objects appeared to have outstanding colors. In general, the majority of the sources in our sample have no optical counterpart and very few have spectral determinations or bibliographical entries.
We detected 20 new binary and 4 new triple systems. The projected separations are as short as 7 mas and the brightness ratios as high as ΔK = 6.5 mag. Some of these systems could be followed up in principle by other high angular resolution techniques, but many others would require a combination of sensitivity and angular resolution that can only be obtained at present by LO. We also detected two sources that appeared to be resolved on the milliarcsecond scale, one of them an OH-IR star, and the other being in a pair that shows a spectral energy distribution rising in the infrared.
We have evaluated the probability of finding chance associations from the average cumulative stellar density in the two regions of our sample and found that for the given separations and magnitude differences the probability is extremely low. The brightness ratios are generally high, with ΔK > 2, and we propose a preferential selection of giant-dwarf pairs as a possible explanation. The very incomplete set of fundamental measurements for the stars of our sample, as well as unanswered questions for example on the hierarchical nature of the triples, make follow-up studies very desirable.
With this paper we have increased the number of unresolved stars with reliable upper limits in the milliarcsecond range, observed in a homogeneous way with the same instrument and method, to about 350. This list, to be further extended with more observations currently under analysis, can serve as a useful reference catalog for interferometric calibrators.
Acknowledgments
A.R. acknowledges support from the ESO Director General’s Discretionary Fund. O.F. acknowledges financial support from MICINN through a Juan de la Cierva fellowship and from MCYT-SEPCYT Plan Nacional I+D+I AYA#2008-01225. We are grateful to the Paranal Observatory staff and in particular to Dr. E. Mason. This research made use of the Simbad database, operated at the CDS, Strasbourg, France, and of data products from the Two Micron All Sky Survey, which is a joint project of the University of Massachusetts and the Infrared Processing and Analysis Center/California Institute of Technology, funded by the National Aeronautics and Space Administration and the National Science Foundation.
References
- Bertin, E., & Arnouts, S. 1996, A&AS, 117, 393 [NASA ADS] [CrossRef] [EDP Sciences] [Google Scholar]
- Bessell, M. S., & Brett, J. M. 1988, PASP, 100, 1134 [NASA ADS] [CrossRef] [Google Scholar]
- Clarke, A. J., Oudmaijer, R. D., & Lumsden, S. L. 2005, MNRAS, 363, 1111 [NASA ADS] [CrossRef] [Google Scholar]
- Deguchi, S., Fujii, T., Glass, I. S., et al. 2004, PASJ, 56, 765 [NASA ADS] [Google Scholar]
- De Medeiros, J. R., Udry, S., Burki, G., & Mayor, M. 2002, A&A, 395, 97 [NASA ADS] [CrossRef] [EDP Sciences] [Google Scholar]
- Dommanget, J., & Nys, O. 2002, VizieR Online Data Catalog, 1274, [Google Scholar]
- Evans, D. S., & Edwards, D. A. 1983, AJ, 88, 1845 [NASA ADS] [CrossRef] [Google Scholar]
- Fabricius, C., Høg, E., Makarov, V. V., et al. 2002, A&A, 384, 180 [NASA ADS] [CrossRef] [EDP Sciences] [Google Scholar]
- Gahm, G. F., Ahlin, P., & Lindroos, K. P. 1983, A&AS, 51, 143 [Google Scholar]
- Hansen, O. L., & Blanco, V. M. 1975, AJ, 80, 1011 [NASA ADS] [CrossRef] [Google Scholar]
- Johnston, H. M., Verbunt, F., & Hasinger, G. 1994, A&A, 289, 763 [NASA ADS] [Google Scholar]
- Kozok, J. R. 1985, A&AS, 62, 7 [NASA ADS] [Google Scholar]
- Mason, B. D., Wycoff, G. L., Hartkopf, W. I., Douglass, G. G., & Worley, C. E. 2001, AJ, 122, 3466 [Google Scholar]
- Merrill, P. W., & Burwell, C. G. 1950, ApJ, 112, 72 [NASA ADS] [CrossRef] [Google Scholar]
- Mignard, F., Söderhjelm, S., Bernstein, H.-H., et al. 1995, A&A, 304, 94 [NASA ADS] [Google Scholar]
- Radick, R. R., Henry, G. W., & Sherlin, J. M. 1984, AJ, 89, 151 [NASA ADS] [CrossRef] [Google Scholar]
- Richichi, A. 1989, A&A, 226, 366 [NASA ADS] [Google Scholar]
- Richichi, A. 1994, Very High Angular Resolution Imaging, ed. J. G. Robertson, & W. J. Tango, IAU Symp., 158, 71 [Google Scholar]
- Richichi, A., Baffa, C., Calamai, G., & Lisi, F. 1996, AJ, 112, 2786 [NASA ADS] [CrossRef] [Google Scholar]
- Richichi, A., Fors, O., Mason, E., Stegmeier, J., & Chandrasekhar, T. 2008a, A&A, 489, 1399 (Paper I) [NASA ADS] [CrossRef] [EDP Sciences] [Google Scholar]
- Richichi, A., Fors, O., & Mason, E. 2008b, A&A, 489, 1441 (Paper II) [NASA ADS] [CrossRef] [EDP Sciences] [Google Scholar]
- Richichi, A., Fors, O., Chen, W.-P., & Mason, E. 2010, A&A, 522, A65 (Paper III) [NASA ADS] [CrossRef] [EDP Sciences] [Google Scholar]
- Rieke, G. H., & Lebofsky, M. J. 1985, ApJ, 288, 618 [NASA ADS] [CrossRef] [Google Scholar]
- Schlegel, D. J., Finkbeiner, D. P., & Davis, M. 1998, ApJ, 500, 525 [NASA ADS] [CrossRef] [Google Scholar]
- Szczerba, R., Siódmiak, N., Stasińska, G., & Borkowski, J. 2007, A&A, 469, 799 [NASA ADS] [CrossRef] [EDP Sciences] [Google Scholar]
- te Lintel Hekkert, P., Caswell, J. L., Habing, H. J., et al. 1991, A&AS, 90, 327 [NASA ADS] [Google Scholar]
- Velghe, A. G. 1957, ApJ, 126, 302 [NASA ADS] [CrossRef] [Google Scholar]
All Tables
All Figures
|
Fig. 1 Color–color diagram for the sources (dots) for which we recorded the LO events listed in Table 2. The left and right panels are for the nights of September 25 and 26, respectively. Note the different scales. The solid and dashed lines are the loci of the unreddened giant and dwarf stars, respectively, according to Bessell & Brett (1988). The arrow is the extinction vector for AV = 10 mag, according to Rieke & Lebofsky (1985). |
| In the text | |
|
Fig. 2 Top: upper panel, data (solid) and best fit (dashed line) for 18022636-2555373. The lower panel shows, displaced by arbitrary offsets and enlarged for clarity, the residuals of the fits by a point-like (above) and by a binary star model including corrections due to slope variations (see text). The normalized χ2 values are 4.42 and 1.46, respectively. The times of the geometrical occultation of two stars are also marked, with their difference corresponding to a separation of 9.9 mas. Bottom: brightness profile reconstructed by the model-independent CAL method. |
| In the text | |
|
Fig. 3 Left: upper panel, data (solid) and best fit (dashed line) for 18063774-2529277. The lower panel shows the residuals of the fit by the profile shown to the right. The normalized χ2 is 1.21. Right: brightness profile reconstructed by the model-independent CAL method. |
| In the text | |
|
Fig. 4 Distribution of the secondary and tertiary companions in our sample, with respect to their respective primaries. The filled circles and empty squares represent the sources observed in the nights of Sep. 25 and 26, respectively. Note that our analysis did not extend beyond about |
| In the text | |
|
Fig. 5 Same as the left side of Fig. 3, for 18012777-2538123 with an upper limit on the angular size of 0.75 mas. The residuals are enlarged and the normalized χ2 is 1.01. More details in Sect. 3.4. |
| In the text | |
Current usage metrics show cumulative count of Article Views (full-text article views including HTML views, PDF and ePub downloads, according to the available data) and Abstracts Views on Vision4Press platform.
Data correspond to usage on the plateform after 2015. The current usage metrics is available 48-96 hours after online publication and is updated daily on week days.
Initial download of the metrics may take a while.