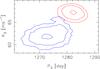
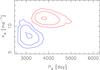
Fig. 2

The equiprobability contours of the period and amplitude parameters of υ And d (top) and υ And e (bottom) containing 50%, 95%, and 99% of the probability density. The red colour denotes the contours given the Lick1 data of Fischer et al. (2003) and blue is used to denote the contours given the Lick2 data of Wright et al. (2009).
Current usage metrics show cumulative count of Article Views (full-text article views including HTML views, PDF and ePub downloads, according to the available data) and Abstracts Views on Vision4Press platform.
Data correspond to usage on the plateform after 2015. The current usage metrics is available 48-96 hours after online publication and is updated daily on week days.
Initial download of the metrics may take a while.