Fig. 8
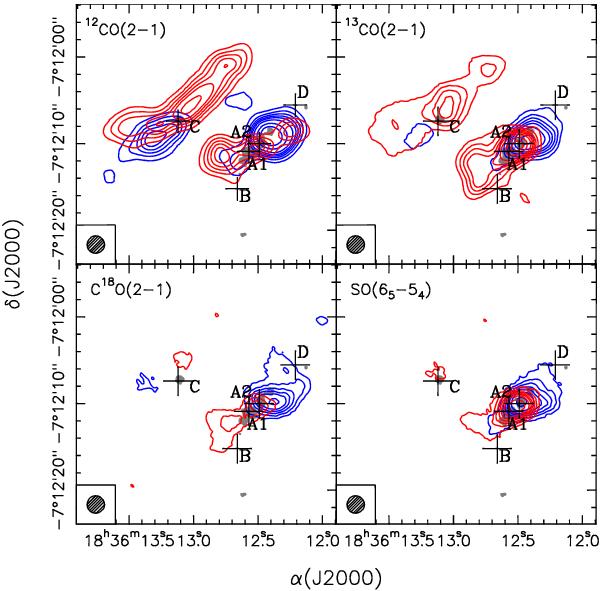
Blueshifted (blue contours) and redshifted (red contours) 12CO (2–1), 13CO (2–1), C18O (2–1), and SO (65–54) averaged emission overlaid on the SMA VEX 1.3 mm continuum emission (grayscale) towards G24. The maps were reconstructed with a circular beam of 2″ to enhance the extended emission. The emission was averaged in the velocity intervals (82, 97) km s-1 (blueshifted emission) and (127, 142) km s-1 (redshifted emission) for 12CO, (94, 103) km s-1 (blueshifted emission) and (116, 127) km s-1 (redshifted emission) for 13CO, (99, 104.4) km s-1 (blueshifted emission) and (115.8, 122.4) km s-1 (redshifted emission) for C18O, and (94, 104.2) km s-1 (blueshifted emission) and (115.6, 124.6) km s-1 (redshifted emission) for SO. Contour levels are 3, 6, 9, 12, 15, 20, 30, and 40 times 1σ, where 1σ is 80 mJy beam-1 for 12CO, 35 mJy beam-1 for 13CO, 18 mJy beam-1 for C18O, and 25 mJy beam-1 SO. Grayscale contour for the continuum emission is 3σ, where 1σ is 3.2 mJy beam-1. The spectral line synthesized beam is shown in the lower left corner. The crosses mark the positions of the sources identified by Furuya et al. (2002) and Beltrán et al. (2004).
Current usage metrics show cumulative count of Article Views (full-text article views including HTML views, PDF and ePub downloads, according to the available data) and Abstracts Views on Vision4Press platform.
Data correspond to usage on the plateform after 2015. The current usage metrics is available 48-96 hours after online publication and is updated daily on week days.
Initial download of the metrics may take a while.