Fig. 6
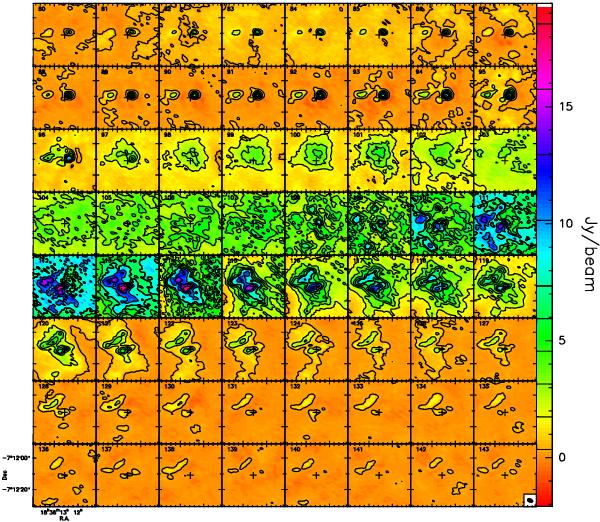
Combined SMA+IRAM 30-m channel maps of the 12CO (2–1) emission towards G24. The contour levels range from 0.35 to 7.35 Jy beam-1 by steps of 1.4 Jy beam-1 and from 7.35 to 18.55 Jy beam-1 by steps of 2.8 Jy beam-1. The cross indicates the phase reference center of the SMA observations. The synthesized beam is shown in the lower right corner of the last panel. The central velocity of each velocity interval is indicated in the upper left corner of each panel.
Current usage metrics show cumulative count of Article Views (full-text article views including HTML views, PDF and ePub downloads, according to the available data) and Abstracts Views on Vision4Press platform.
Data correspond to usage on the plateform after 2015. The current usage metrics is available 48-96 hours after online publication and is updated daily on week days.
Initial download of the metrics may take a while.