Fig. 5
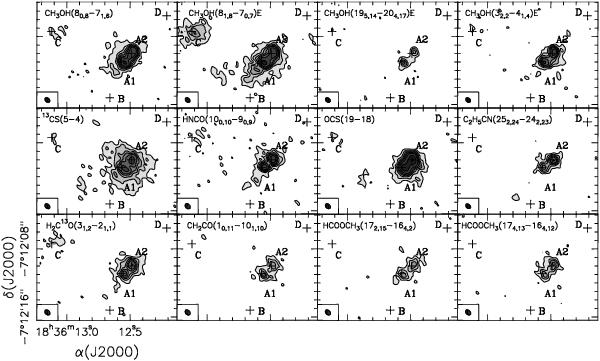
Images of the emission averaged in the velocity interval (105, 115) km s-1 for some observed molecular species towards G24. Contour levels are 3, 6, 9, 12, 15, 20, 30, and 40 times σ, where 1σ is 15 mJy beam-1 for all species except CH3OH (81,8–70,7), 13CS (5–4), and OCS (19–18) for which 1σ is 18 mJy beam-1. The crosses mark the positions of the sources identified by Furuya et al. (2002) and Beltrán et al. (2004). The synthesized beam is shown in the lower left corner.
Current usage metrics show cumulative count of Article Views (full-text article views including HTML views, PDF and ePub downloads, according to the available data) and Abstracts Views on Vision4Press platform.
Data correspond to usage on the plateform after 2015. The current usage metrics is available 48-96 hours after online publication and is updated daily on week days.
Initial download of the metrics may take a while.