Fig. 15
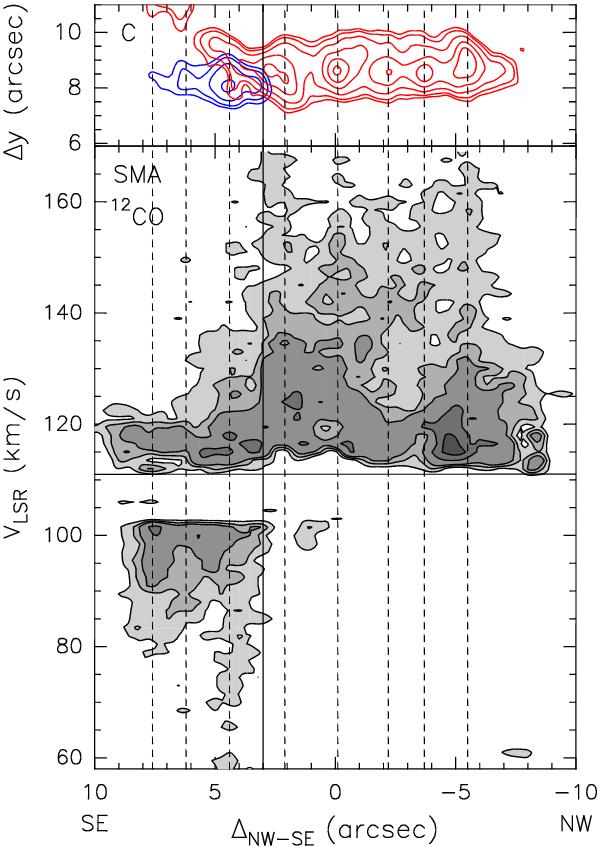
(Top panel) Blueshifted (blue contours) and redshifted (red contours) 12CO (2–1) emission towards G24 C. The emission has been averaged in the velocity intervals (58, 74.5) km s-1 (blueshifted emission) and (148, 167.5) km s-1 (redshifted emission). The molecular outflow map has been rotated −45°. The offsets are measured from the phase center, positive towards southeast. Contour levels are 3, 4, 6, 9, and 12 times 1σ, where 1σ is 15 mJy beam-1 (12 mJy) for the blueshifted (redshifted) emission. (Bottom panel) Same as bottom left panel of Fig. 10. The vertical and horizontal solid lines indicate the position of core C and the VLSR, respectively. The position of each knot along the outflow axis is marked with a vertical dashed line.
Current usage metrics show cumulative count of Article Views (full-text article views including HTML views, PDF and ePub downloads, according to the available data) and Abstracts Views on Vision4Press platform.
Data correspond to usage on the plateform after 2015. The current usage metrics is available 48-96 hours after online publication and is updated daily on week days.
Initial download of the metrics may take a while.