Fig. 13
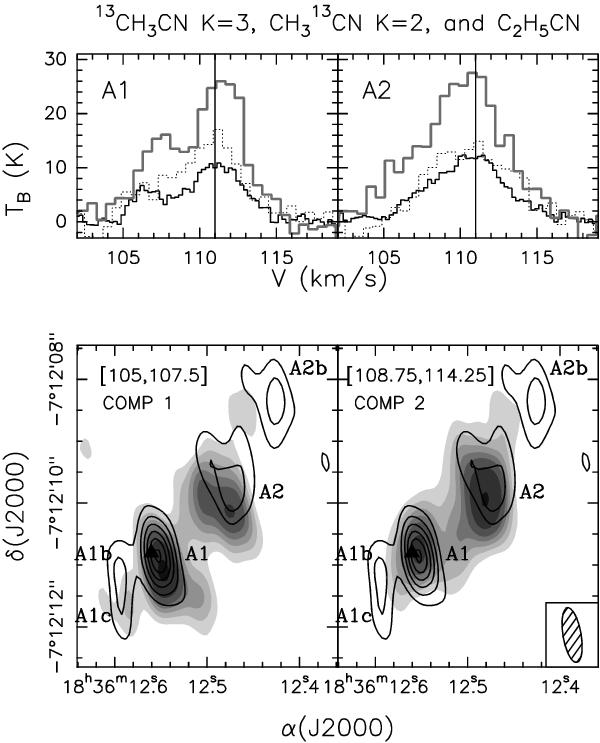
(Top panels) 13CH3CN (12–11) K = 3 (black line), CH CN (12–11) K = 2 (dotted line), and C2H5CN (252,24–242,23) (gray line) obtained by integrating the emission inside the 3σ contour level area towards G24 A1 (left) and A2 (right). The vertical solid line indicates the VLSR. (Bottom panels) Overlay of the averaged emission in the velocity interval (105, 107.5) km s-1 (component 1; left) and (108.75, 114.25) km s-1 (component 2; right) of the 13CH3CN (12–11) K = 3 transition on the map of the 1.4 mm continuum emission obtained with the PdBI towards G24 A1 and A2. Contour levels are the same as in Fig. 1. The grayscale levels are 3, 6, 9, 12, 15, 20, and 30 times σ, where 1σ is 3.7 mJy beam-1 for component 1, and 7.2 mJy beam-1 for component 2. The black triangle marks the position of the HC Hii region in G24 A1 (Beltrán et al. 2007). The synthesized beam is shown in the lower right corner.
Current usage metrics show cumulative count of Article Views (full-text article views including HTML views, PDF and ePub downloads, according to the available data) and Abstracts Views on Vision4Press platform.
Data correspond to usage on the plateform after 2015. The current usage metrics is available 48-96 hours after online publication and is updated daily on week days.
Initial download of the metrics may take a while.