Fig. 12
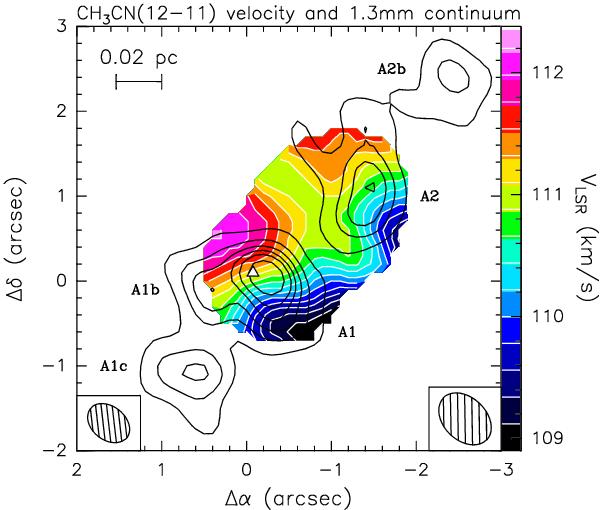
Overlay of the map of the 1.3 mm continuum emission obtained with the very extended SMA configuration (contours) on that of the CH3CN (12–11) line velocity (color scale). Contour levels are the same as in Fig. 1. Offsets are measured with respect to the phase center. The triangle marks the position of the HC Hii region in G24 A1 (Beltrán et al. 2007). The synthesized beam of the continuum (line) emission is shown in the lower left (right) corner.
Current usage metrics show cumulative count of Article Views (full-text article views including HTML views, PDF and ePub downloads, according to the available data) and Abstracts Views on Vision4Press platform.
Data correspond to usage on the plateform after 2015. The current usage metrics is available 48-96 hours after online publication and is updated daily on week days.
Initial download of the metrics may take a while.