Fig. 10
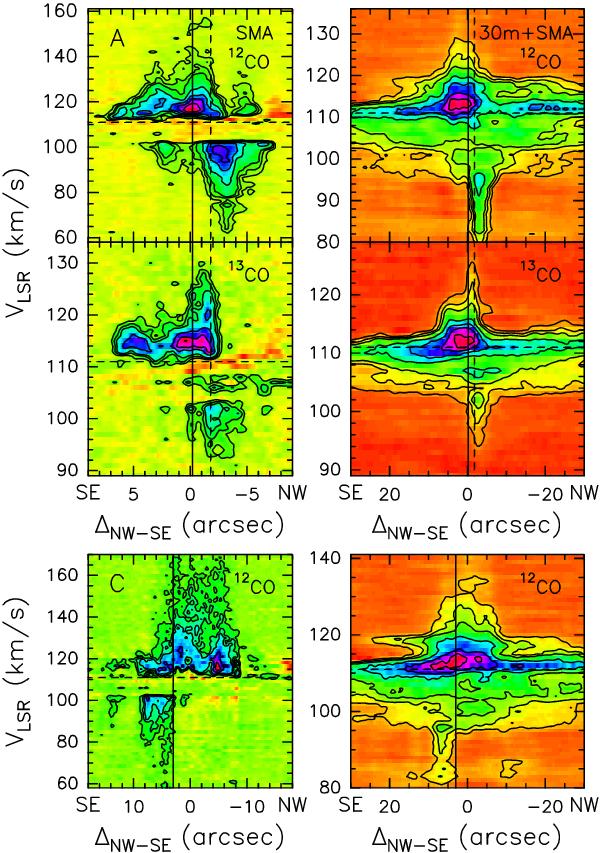
Position-velocity plots along the direction with PA = −40° for outflow A (top and middle panels) and PA = −45° for outflow C (bottom panels). The offsets are measured from the phase center, positive towards southeast. Contour levels are 3σ, 6σ 9σ to 45σ by steps of 6σ where σ is 0.033 Jy beam-1 for 12CO SMA, 0.33 Jy beam-1 for 12CO SMA+IRAM 30-m, 0.027 Jy beam-1 for 13CO SMA, and 0.23 Jy beam-1 for 13CO SMA+IRAM 30-m. The SMA maps have the highest angular resolution. (Top and middle panels) The vertical solid and dashed lines indicate the position of cores A1 and A2, respectively. The horizontal dashed line indicates the VLSR. (Bottom panels) The vertical solid line indicates the position of core C. The horizontal dashed line indicates the VLSR.
Current usage metrics show cumulative count of Article Views (full-text article views including HTML views, PDF and ePub downloads, according to the available data) and Abstracts Views on Vision4Press platform.
Data correspond to usage on the plateform after 2015. The current usage metrics is available 48-96 hours after online publication and is updated daily on week days.
Initial download of the metrics may take a while.