Fig. 1
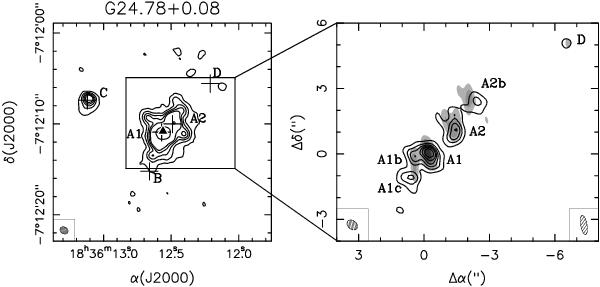
(Left panel) SMA map of the 1.3 mm continuum emission obtained by combining both compact and very extended configurations. Contour levels are 3, 6, 9, 12, 15, 35, and 60 times σ, where 1σ is 3 mJy beam-1. The crosses mark the positions of the sources identified by Furuya et al. (2002) and Beltrán et al. (2004). The triangle marks the position of the HC Hii region in G24 A1 (Beltrán et al. 2007). The SMA synthesized beam is shown in the lower left corner. (Right panel) SMA map at 1.3 mm obtained with the very extended configuration (contours) overlaid on the PdBI map at 1.4 mm (grayscale) towards G24 A1, A2, and D. Contour and grayscale levels are 3, 6, 9, 12, 15, and 20 times σ, where 1σ is 3.2 mJy beam-1. The SMA synthesized beam is shown in the lower left corner and the PdBI one in the lower right corner.
Current usage metrics show cumulative count of Article Views (full-text article views including HTML views, PDF and ePub downloads, according to the available data) and Abstracts Views on Vision4Press platform.
Data correspond to usage on the plateform after 2015. The current usage metrics is available 48-96 hours after online publication and is updated daily on week days.
Initial download of the metrics may take a while.