Free Access
Fig. 5
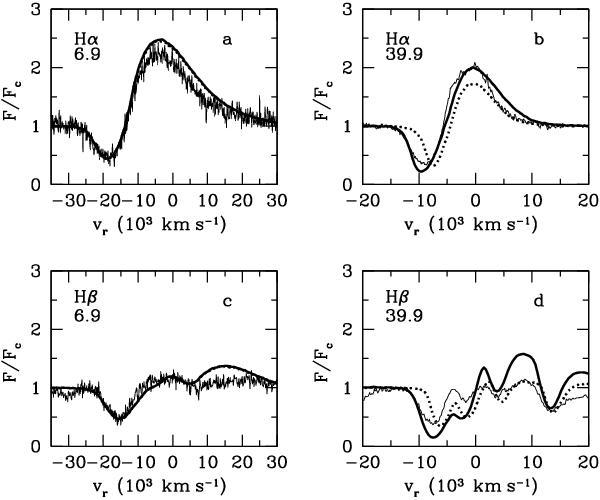
The Hα and Hβ lines on Days 7 and 40. The model profiles are calculated for two cases of 56Ni mixing, strong (thick solid line) and moderate (dotted line), and overplotted on the observed profiles (thin solid line). Modeling the Hβ profile includes the Fe II 4924, 5018, 5169 Å and Ba II 4935 Å lines.
Current usage metrics show cumulative count of Article Views (full-text article views including HTML views, PDF and ePub downloads, according to the available data) and Abstracts Views on Vision4Press platform.
Data correspond to usage on the plateform after 2015. The current usage metrics is available 48-96 hours after online publication and is updated daily on week days.
Initial download of the metrics may take a while.