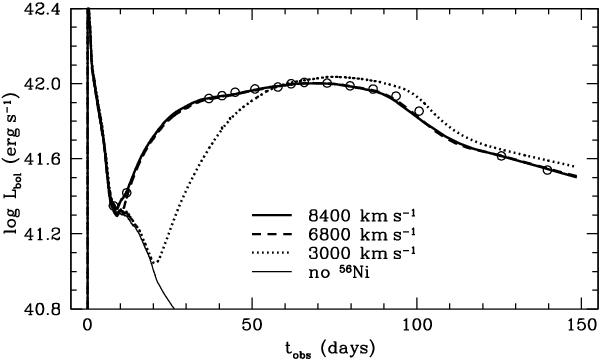
Fig. 4

The bolometric light curve of the optimal model (thick solid line) overplotted on the empirical bolometric light curve of SN 2000cb recovered from the BVI magnitudes reported by Kleiser et al. (2011) (open circles). Dashed line represents the model with the moderate 56Ni mixing to 6800 km s-1 compared to the one in the optimal model up to 8400 km s-1 (Fig. 3). Dotted line shows the light curve of the model with the 56Ni mixing to 3000 km s-1 observed in SN 1987A. The light curve in the absence of radioactive 56Ni is shown by a thin solid line.
Current usage metrics show cumulative count of Article Views (full-text article views including HTML views, PDF and ePub downloads, according to the available data) and Abstracts Views on Vision4Press platform.
Data correspond to usage on the plateform after 2015. The current usage metrics is available 48-96 hours after online publication and is updated daily on week days.
Initial download of the metrics may take a while.


