Fig. 4
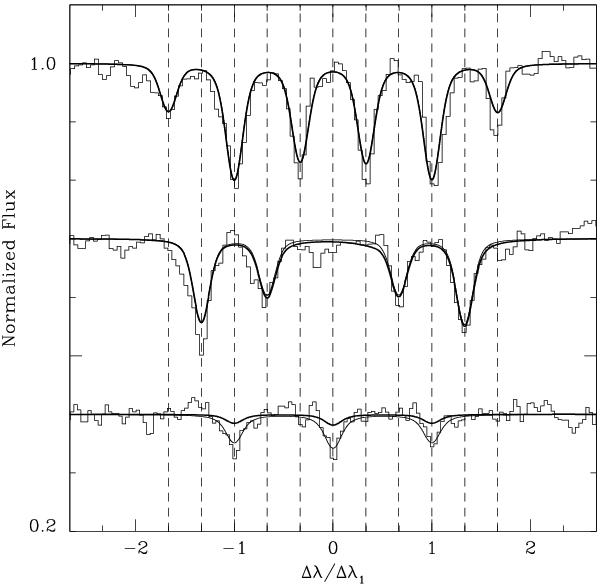
X-shooter spectrum of the Ca I (bottom) and Ca II (H & K: middle and top, respectively) lines and best-fitting models at (log g = 8) Teff = 5400 K and log n(Ca)/n(H) = −10.3 (thick lines), and Teff = 4900 K and log n(Ca)/n(H) = −10.45 (thin lines). The wavelength scale is normalized to Δλ1 ≡ 4.67 × 10⁻⁷λ2B, where B = 0.513 MG. Therefore, the line positions match the factors glml − gumu listed in Table 4 (vertical dashed lines). All models assume ψ = 60°.
Current usage metrics show cumulative count of Article Views (full-text article views including HTML views, PDF and ePub downloads, according to the available data) and Abstracts Views on Vision4Press platform.
Data correspond to usage on the plateform after 2015. The current usage metrics is available 48-96 hours after online publication and is updated daily on week days.
Initial download of the metrics may take a while.