Fig. 6
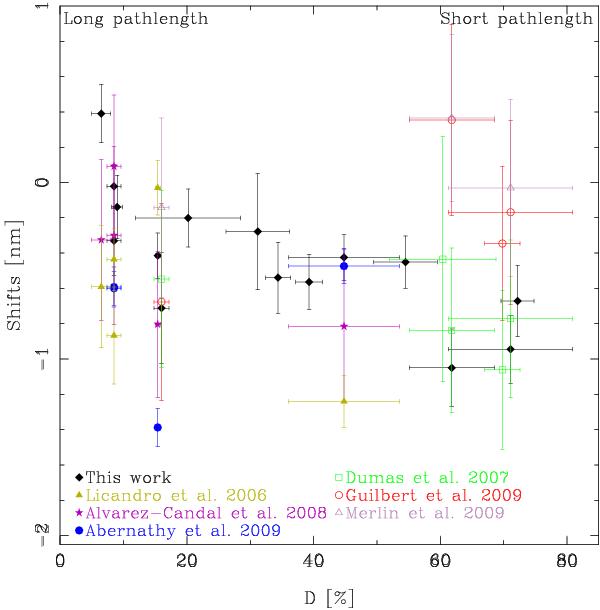
Measured wavelength shifts vs. averaged Dλ. The averaged Dλ is the average value as obtained from the Eris entries in Table 2, the error bar is just the standard deviation around the average. Dλ is used as proxy of real depth in the surface, as indicated by the legends on the top of the figure. Note that with exception of the XS spectrum, filled symbols are used for absorption bands in the visible and open ones for bands in the near-infrared (λ > 1000 nm).
Current usage metrics show cumulative count of Article Views (full-text article views including HTML views, PDF and ePub downloads, according to the available data) and Abstracts Views on Vision4Press platform.
Data correspond to usage on the plateform after 2015. The current usage metrics is available 48-96 hours after online publication and is updated daily on week days.
Initial download of the metrics may take a while.