Fig. 2
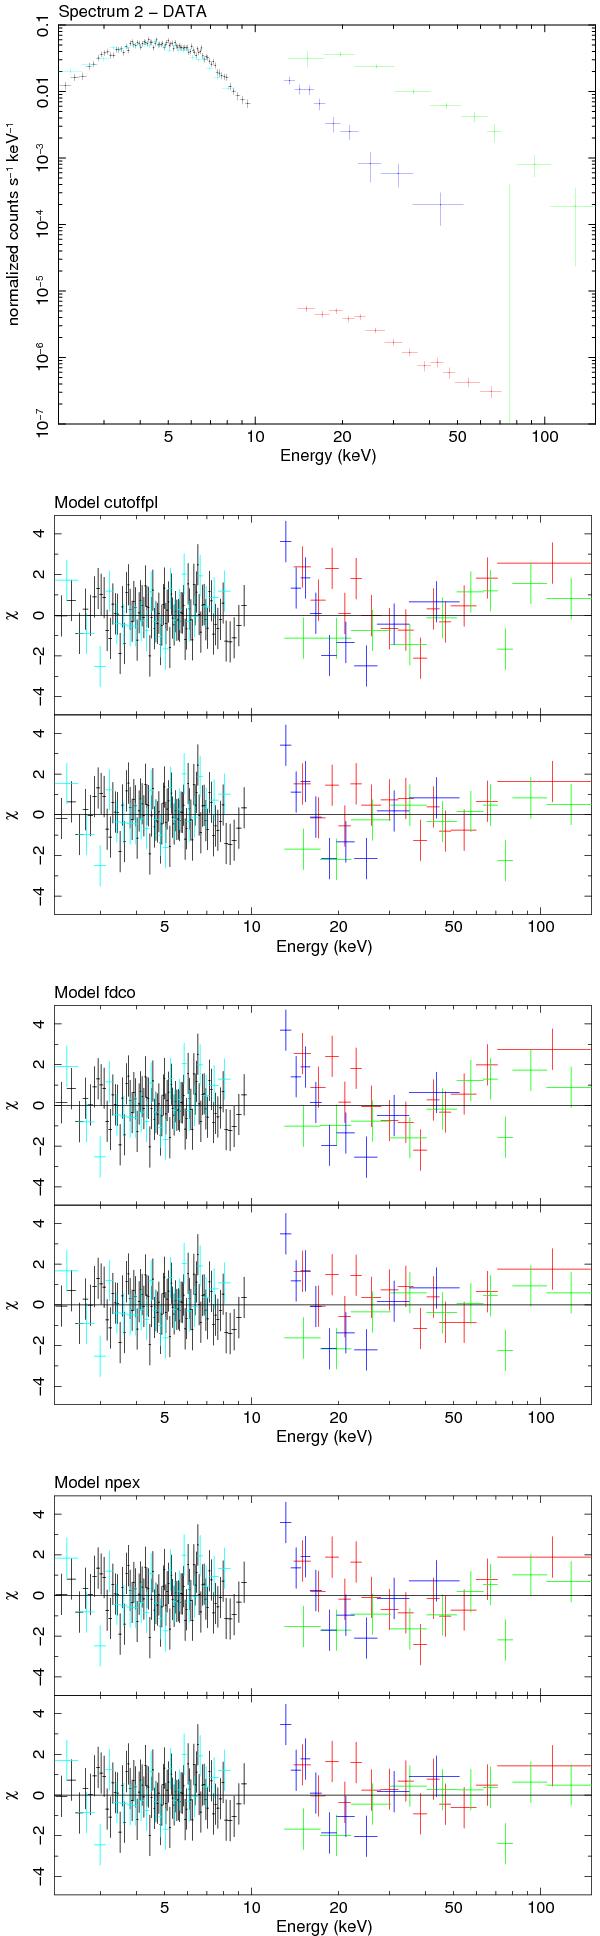
Upper panel: datasets that compose the spectrum 2 analysis. Black data: XIS023 spectrum; red data: BAT spectrum; green data: ISGRI spectrum; blue data: Suzaku/HXD-PIN spectrum; light blue: XIS0 spectrum. Lower panels: residuals in units of σ for the continuum models of Table 1; upper mid-panels: only continuum, lower mid-panels: continuum with the addition of a cyclotron absorption feature at ~ 31 keV.
Current usage metrics show cumulative count of Article Views (full-text article views including HTML views, PDF and ePub downloads, according to the available data) and Abstracts Views on Vision4Press platform.
Data correspond to usage on the plateform after 2015. The current usage metrics is available 48-96 hours after online publication and is updated daily on week days.
Initial download of the metrics may take a while.