Fig. 6
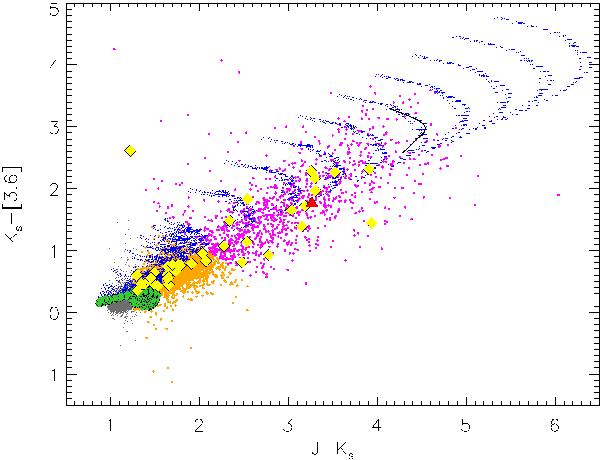
The Ks − [3.6] vs. J − Ks CCD, same symbols as in Fig. 3. The “arc" slightly blueward of OGLE LMC LPV 28579 consists of the τ11.3 = 0.3 models. The variation of the J − Ks color with effective temperature of the central star is depicted by the solid black curve for log g = 0, M = 2 M⊙, C/O = 2, τ11.3 = 0.6 and Rin = 7 Rstar (Teff decreases in the direction of increasing Ks − [3.6] color).
Current usage metrics show cumulative count of Article Views (full-text article views including HTML views, PDF and ePub downloads, according to the available data) and Abstracts Views on Vision4Press platform.
Data correspond to usage on the plateform after 2015. The current usage metrics is available 48-96 hours after online publication and is updated daily on week days.
Initial download of the metrics may take a while.