Fig. 3
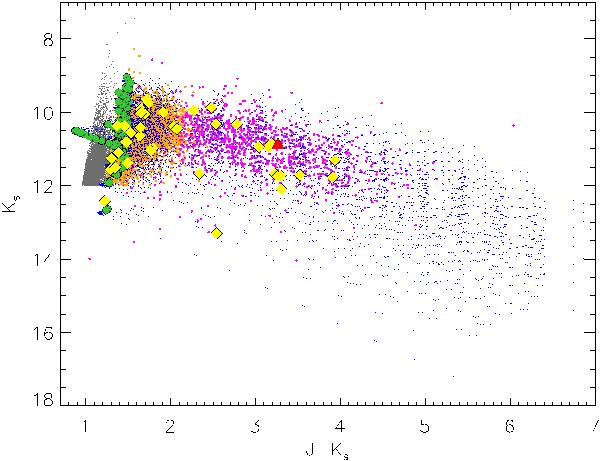
the Ks vs. J − Ks CMD shows the model grid (light blue points) overlaid onto the SAGE AGB candidates from Paper I (gray: O-rich, orange: C-rich and pink: extreme). The yellow diamonds are SAGE sources identified as carbon-rich from their SAGE-Spec spectra. The large red triangle is OGLE LMC LPV 28579. Also shown are the Aringer et al. (2009) photospheres (green squares) used to generate the grid. The “spike” running across the O-rich AGB candidates consists of models with Teff warmer than 3500 K. The cloud of models with τ11.3 = 0.3 is seen at J − Ks ~ 3 mag.
Current usage metrics show cumulative count of Article Views (full-text article views including HTML views, PDF and ePub downloads, according to the available data) and Abstracts Views on Vision4Press platform.
Data correspond to usage on the plateform after 2015. The current usage metrics is available 48-96 hours after online publication and is updated daily on week days.
Initial download of the metrics may take a while.