Fig. 1
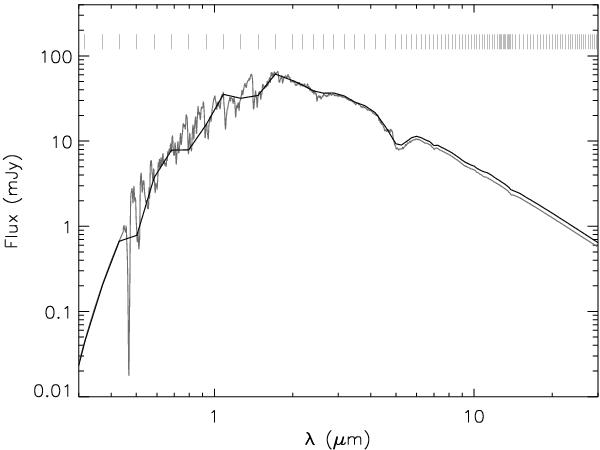
Aringer et al. (2009) photosphere spectrum (gray) with Teff = 3300 K and log (g [cm s-1]) = −0.2, showing many strong features at shorter wavelengths. The vertical dashes show the wavelengths at which this spectrum was sampled for input to 2Dust. The resulting GRAMS output model with optical depth τ11.3 = 2 × 10⁻³ (black) incorporates some of the variation in the optical.
Current usage metrics show cumulative count of Article Views (full-text article views including HTML views, PDF and ePub downloads, according to the available data) and Abstracts Views on Vision4Press platform.
Data correspond to usage on the plateform after 2015. The current usage metrics is available 48-96 hours after online publication and is updated daily on week days.
Initial download of the metrics may take a while.