Fig. 5
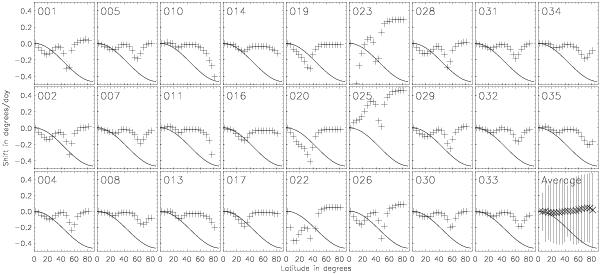
Examples of the cross-correlation results using the 36 individual snapshots from the dynamo model L1. The crosses give the shift in degrees/day for each latitude between 4.2° and 83.7°. The solid line in the plots shows the input rotation law for the dynamo model at the surface. The last plot is the average behaviour obtained from all snapshots with using the standard deviation of the measurements as the error.
Current usage metrics show cumulative count of Article Views (full-text article views including HTML views, PDF and ePub downloads, according to the available data) and Abstracts Views on Vision4Press platform.
Data correspond to usage on the plateform after 2015. The current usage metrics is available 48-96 hours after online publication and is updated daily on week days.
Initial download of the metrics may take a while.